Publication Cover
Caryologia
International Journal of Cytology, Cytosystematics and Cytogenetics
Volume 69, 2016 - Issue 2
1,063
Views
8
CrossRef citations to date
0
Altmetric
Articles

In vitro anti-proliferative and apoptotic effects of ethanolic extract of Cissus quadrangularis

, &
Pages 128-132 | Received 18 Mar 2015, Accepted 23 Nov 2015, Published online: 26 Feb 2016

Figures & data

Figure 1. Photomicrographs of A431 cells either untreated or treated with CQ extract for 24 h: (a) untreated; (b) CQ extract at 50 μg ml−1; (c) CQ extract at 100 μg ml−1; (d) CQ extract at 250 μg ml−1.
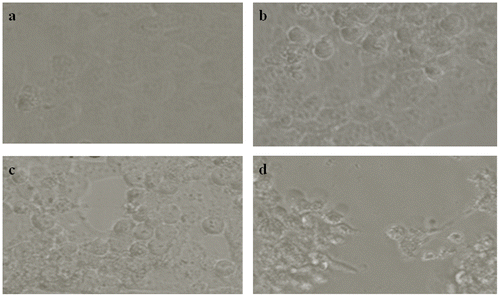
Figure 1. Photomicrographs of A431 cells either untreated or treated with CQ extract for 24 h: (a) untreated; (b) CQ extract at 50 μg ml−1; (c) CQ extract at 100 μg ml−1; (d) CQ extract at 250 μg ml−1.

Figure 2. Cytotoxicity of 24-h CQ extract treatment on A431 cells, assessed using an MTT assay. Each value represents the mean ± SE of three tests. Treated versus control (*p < 0.05).
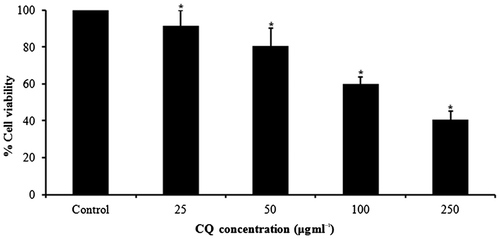
Figure 2. Cytotoxicity of 24-h CQ extract treatment on A431 cells, assessed using an MTT assay. Each value represents the mean ± SE of three tests. Treated versus control (*p < 0.05).

Figure 3. CQ extract induced ROS generation in A431 cells. (a) Percentage of ROS production due to CQ extract in A431 cells. (b–e) Photomicrographs captured with a fluorescence microscope after CQ extract exposure for 24 h: (b) untreated; (c) at 25 μg ml−1; (d) at 50 μg ml−1; (e) at 100 μg ml−1.*p < 0.05 versus control.
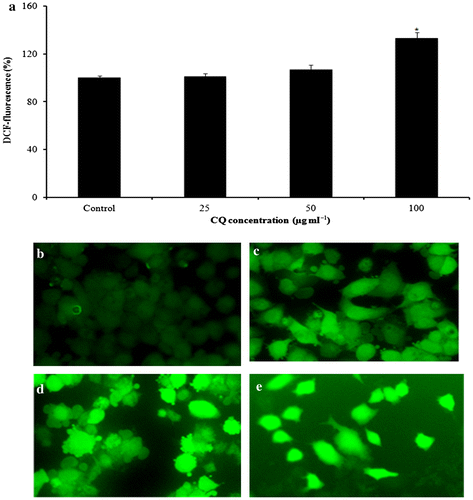
Figure 3. CQ extract induced ROS generation in A431 cells. (a) Percentage of ROS production due to CQ extract in A431 cells. (b–e) Photomicrographs captured with a fluorescence microscope after CQ extract exposure for 24 h: (b) untreated; (c) at 25 μg ml−1; (d) at 50 μg ml−1; (e) at 100 μg ml−1.*p < 0.05 versus control.

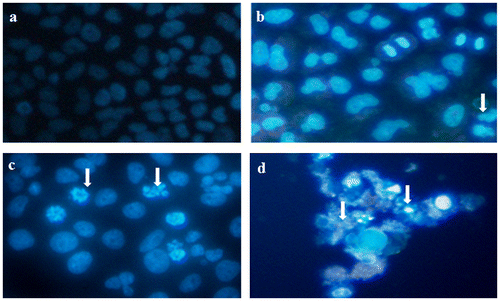
Figure 4. Shrinkage of chromosome in A431 cells due to CQ extract exposure for 24 h. Photomicrographs captured with a fluorescence microscope: (a) untreated; (b) at 25 μg ml−1; (c) at 50 μg ml−1; (d) at 100 μg ml−1.

Figure 4. Shrinkage of chromosome in A431 cells due to CQ extract exposure for 24 h. Photomicrographs captured with a fluorescence microscope: (a) untreated; (b) at 25 μg ml−1; (c) at 50 μg ml−1; (d) at 100 μg ml−1.

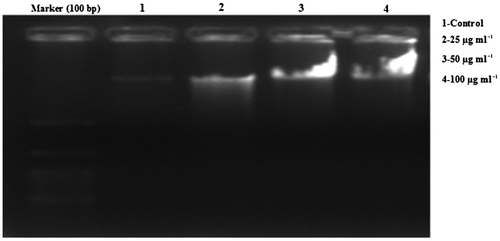
Figure 5. DNA fragmentation of A431 cells after exposure to CQ extract for 24 h.

Figure 5. DNA fragmentation of A431 cells after exposure to CQ extract for 24 h.

Reprints and Corporate Permissions

Please note: Selecting permissions does not provide access to the full text of the article, please see our help page How do I view content?

To request a reprint or corporate permissions for this article, please click on the relevant link below:

Academic Permissions

Please note: Selecting permissions does not provide access to the full text of the article, please see our help page How do I view content?

Obtain permissions instantly via Rightslink by clicking on the button below:

If you are unable to obtain permissions via Rightslink, please complete and submit this Permissions form. For more information, please visit our Permissions help page.