Publication Cover
Caryologia
International Journal of Cytology, Cytosystematics and Cytogenetics
Volume 69, 2016 - Issue 2
1,096
Views
14
CrossRef citations to date
0
Altmetric
Articles

In vitro and in vivo genotoxicity and molecular response of silver nanoparticles on different biological model systems

, , &

Figures & data

Figure 1. Cytotoxic activity of three concentrations of silver nanoparticles (μg ml–1) from different weight ratios of silver metal (1, 3 and 5%) against MCF-7 cell line (survival %).

**Statistically significant at p ≤ 0.01.
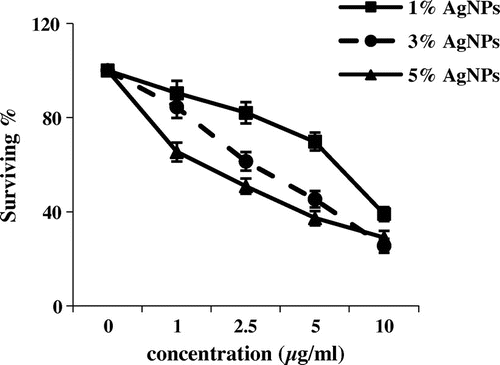
Figure 1. Cytotoxic activity of three concentrations of silver nanoparticles (μg ml–1) from different weight ratios of silver metal (1, 3 and 5%) against MCF-7 cell line (survival %).**Statistically significant at p ≤ 0.01.

Figure 2. Cytotoxic activity of three concentrations of silver nanoparticles (μg ml–1) from different weight ratios of silver metal (1, 3 and 5%) against HepG2 cell line (survival %).
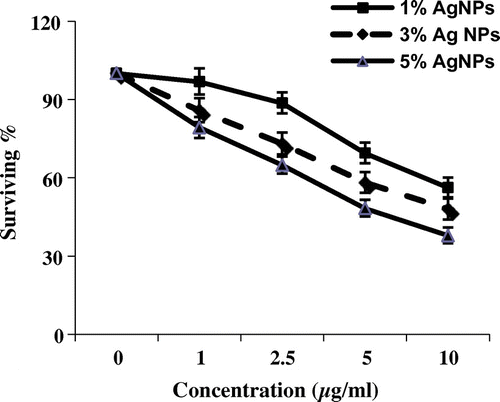
Figure 2. Cytotoxic activity of three concentrations of silver nanoparticles (μg ml–1) from different weight ratios of silver metal (1, 3 and 5%) against HepG2 cell line (survival %).

Figure 3. Mitotic index of Allium cepa meristems treated with silver nanoparticles. aStatistically significant at p ≤ 0.01.
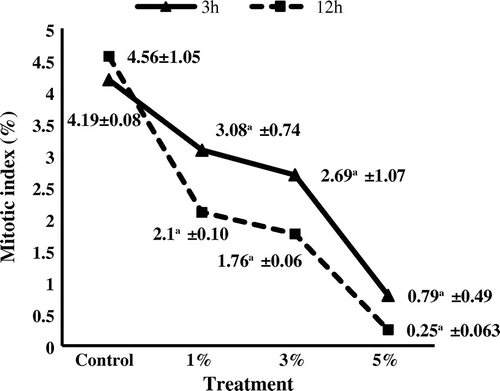
Figure 3. Mitotic index of Allium cepa meristems treated with silver nanoparticles. aStatistically significant at p ≤ 0.01.

Figure 4. Types of chromosomal aberrations induced in Allium cepa meristems treated with silver nanoparticles. (a, b) irregular prophase; (c, d) c-metaphase; (e, f) disturbed anaphase; (g) sticky anaphase; (h) chromatin bridge; (i) chromosomal break and micronucleus in metaphase; (j) micronuclei in interphase; (k) uniucleate cell with two micronuclei (binucleate); (l) multinucleate cell in interphase.
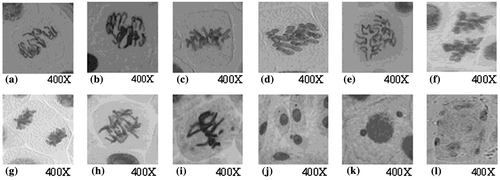
Figure 4. Types of chromosomal aberrations induced in Allium cepa meristems treated with silver nanoparticles. (a, b) irregular prophase; (c, d) c-metaphase; (e, f) disturbed anaphase; (g) sticky anaphase; (h) chromatin bridge; (i) chromosomal break and micronucleus in metaphase; (j) micronuclei in interphase; (k) uniucleate cell with two micronuclei (binucleate); (l) multinucleate cell in interphase.

Figure 5. Percentage of micronucleus induced in Allium cepa meristems treated with silver nanoparticles.

aStatistically significant at p ≤ 0.05.

bStatistically significant at p ≤ 0.01.
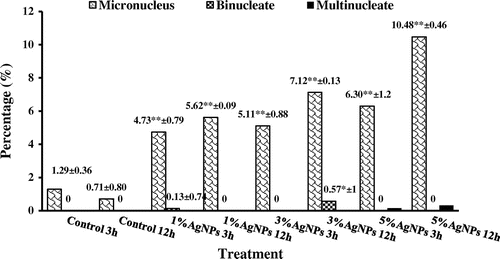
Figure 5. Percentage of micronucleus induced in Allium cepa meristems treated with silver nanoparticles.aStatistically significant at p ≤ 0.05.bStatistically significant at p ≤ 0.01.

Figure 6. Change in protein profile of (a) Staphylococcus aureus and (b) Pseudomonas aeruginosa after treatment with silver nanoparticles.

(a) M: Marker; Sc: S. aureus control; S1%: S. aureus treated with 1% AgNPs; S3%: S. aureus treated with 3% AgNPs; S5%: S. aureus treated with 5% AgNPs.

(b) M: Marker; Pc: P. aeruginosa control; P1%: P. aeruginosa treated with 1% AgNPs;P3%: P. aeruginosa treated with 3% AgNPs; P5%: P. aeruginosa treated with 5% AgNPs.

Figure 6. Change in protein profile of (a) Staphylococcus aureus and (b) Pseudomonas aeruginosa after treatment with silver nanoparticles.(a) M: Marker; Sc: S. aureus control; S1%: S. aureus treated with 1% AgNPs; S3%: S. aureus treated with 3% AgNPs; S5%: S. aureus treated with 5% AgNPs.(b) M: Marker; Pc: P. aeruginosa control; P1%: P. aeruginosa treated with 1% AgNPs;P3%: P. aeruginosa treated with 3% AgNPs; P5%: P. aeruginosa treated with 5% AgNPs.

Figure 7. DNA polymorphism based on RAPD-PCR analysis of (a) Staphylococcus aureus and (b) Pseudomonas aeruginosa treated with silver nanoparticles.

(a) M: Marker; c: S. aureus control; T1: S. aureus treated with 1% AgNPs; T2: S. aureus treated with 3% AgNPs; T3: S. aureus treated with 5% AgNPs.

(b) M: Marker; c: P. aeruginosa control; T1: P. aeruginosa treated with 1% AgNPs; T2: P. aeruginosa treated with 3% AgNPs; T3: P. aeruginosa treated with 5% AgNPs.
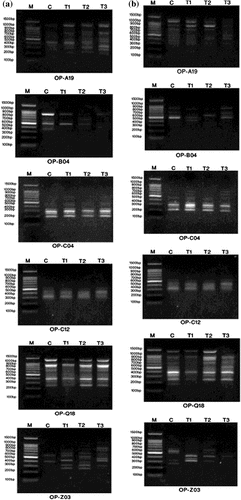
Figure 7. DNA polymorphism based on RAPD-PCR analysis of (a) Staphylococcus aureus and (b) Pseudomonas aeruginosa treated with silver nanoparticles.(a) M: Marker; c: S. aureus control; T1: S. aureus treated with 1% AgNPs; T2: S. aureus treated with 3% AgNPs; T3: S. aureus treated with 5% AgNPs.(b) M: Marker; c: P. aeruginosa control; T1: P. aeruginosa treated with 1% AgNPs; T2: P. aeruginosa treated with 3% AgNPs; T3: P. aeruginosa treated with 5% AgNPs.
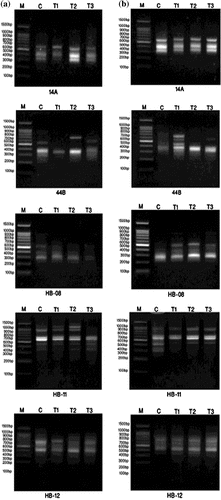
Figure 8. DNA polymorphism based on ISSR-PCR analysis of (a) Staphylococcus aureus and (b) Pseudomonas aeruginosa treated with silver nanoparticles.

(a) M: Marker; c: S. aureus control; T1: S. aureus treated with 1% AgNPs; T2: S. aureus treated with 3% AgNPs; T3: S. aureus treated with 5% AgNPs

(b) M: Marker; c: P. aeruginosa control; T1: P. aeruginosa treated with 1% AgNPs; T2: P. aeruginosa treated with 3% AgNPs; T3: P. aeruginosa treated with 5% AgNPs.
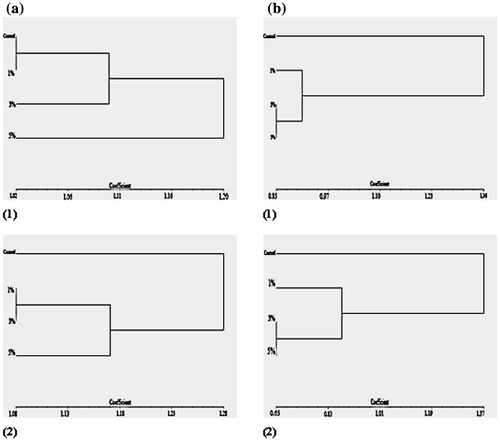
Figure 8. DNA polymorphism based on ISSR-PCR analysis of (a) Staphylococcus aureus and (b) Pseudomonas aeruginosa treated with silver nanoparticles.(a) M: Marker; c: S. aureus control; T1: S. aureus treated with 1% AgNPs; T2: S. aureus treated with 3% AgNPs; T3: S. aureus treated with 5% AgNPs(b) M: Marker; c: P. aeruginosa control; T1: P. aeruginosa treated with 1% AgNPs; T2: P. aeruginosa treated with 3% AgNPs; T3: P. aeruginosa treated with 5% AgNPs.

Table 1. Percentage of mitotic abnormalities and phase distribution of Allium cepa meristems treated with silver nanoparticles in different mitotic phases.

Table 2. Percentage of different types of abnormalities induced in Allium cepa meristems after treatment with silver nanoparticles.

Table 3a. SDS-PAGE electrophoretic profile of Staphylococcus aureus with intensities after treating with silver nanoparticles.

Table 3b. SDS-PAGE electrophoretic profile of Pseudomonas aeruginosa with intensities after treating with silver nanoparticles.

Table 4. RAPD-PCR and ISSR-PCR fragments, distribution of unique and polymorphic bands, monomorphic bands and percentage of polymorphism generated in Staphylococcus aureus treated with silver nanoparticles.

Table 5. RAPD-PCR and ISSR-PCR fragments, distribution of unique and polymorphic bands, monomorphic bands and percentage of polymorphism generated in Pseudomonas aeruginosa treated with silver nanoparticles.

Figure 9. UPGMA dendogram based on (a) RAPD-PCR and (b) ISSR-PCR analysis, clarifying genetic differences between the studied treatments: (1) Staphylococcus aureus; (2) Pseudomonas aeruginosa.

Figure 9. UPGMA dendogram based on (a) RAPD-PCR and (b) ISSR-PCR analysis, clarifying genetic differences between the studied treatments: (1) Staphylococcus aureus; (2) Pseudomonas aeruginosa.

Reprints and Corporate Permissions

Please note: Selecting permissions does not provide access to the full text of the article, please see our help page How do I view content?

To request a reprint or corporate permissions for this article, please click on the relevant link below:

Academic Permissions

Please note: Selecting permissions does not provide access to the full text of the article, please see our help page How do I view content?

Obtain permissions instantly via Rightslink by clicking on the button below:

If you are unable to obtain permissions via Rightslink, please complete and submit this Permissions form. For more information, please visit our Permissions help page.