Publication Cover
Caryologia
International Journal of Cytology, Cytosystematics and Cytogenetics
Volume 69, 2016 - Issue 3
663
Views
2
CrossRef citations to date
0
Altmetric
Articles

Karyotype analysis of Alocasia cucullata (Lour.) Schott using fluorochrome banding and fluorescence in situ hybridization with rDNA probes

Figures & data

Table 1. Chromosome measurements of Alocasia cucullata.

Figure 1. Mitotic chromosomes and interphase nuclei of Alocasia cucullata after sequential CPD staining and FISH with 5S and 45S rDNA probes. (A, C) CPD banded metaphase and interphase cells, respectively. (B, D) The chromosomes and interphase nucleus hybridized with 5S (red) and 45S (green) rDNA probes and counterstained using DAPI (blue). (E) The karyotype showing CPD and DAPI+ bands. (F) The karyotype showing rDNA FISH signals and DAPI+ bands. Chromosome numbers in (A) are designated by means of karyotyping. Red arrowheads in (A) and (C) indicate the CPD bands and CPD-banded blocks, respectively; Blue arrows in (A) and (B) indicate the DAPI+ bands; Green arrowheads in (D) indicate the four strongly fluorescing knobs of the 45S rDNA signals. Scale bars represent 5 μm.
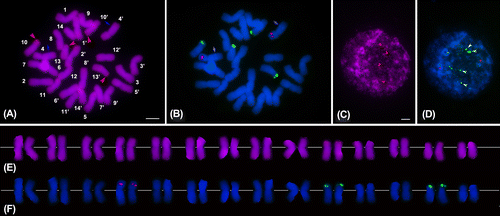
Figure 1. Mitotic chromosomes and interphase nuclei of Alocasia cucullata after sequential CPD staining and FISH with 5S and 45S rDNA probes. (A, C) CPD banded metaphase and interphase cells, respectively. (B, D) The chromosomes and interphase nucleus hybridized with 5S (red) and 45S (green) rDNA probes and counterstained using DAPI (blue). (E) The karyotype showing CPD and DAPI+ bands. (F) The karyotype showing rDNA FISH signals and DAPI+ bands. Chromosome numbers in (A) are designated by means of karyotyping. Red arrowheads in (A) and (C) indicate the CPD bands and CPD-banded blocks, respectively; Blue arrows in (A) and (B) indicate the DAPI+ bands; Green arrowheads in (D) indicate the four strongly fluorescing knobs of the 45S rDNA signals. Scale bars represent 5 μm.

Figure 2. Idiogram of Alocasia cucullata displaying the chromosome measurements, fluorochrome bands and rDNA FISH signals. Light gray, gray and black blocks represent the 5S rDNA site, 45S rDNA site (CPD band) and DAPI+ band, respectively. The ordinate scale on the left indicates the relative length of the chromosomes.
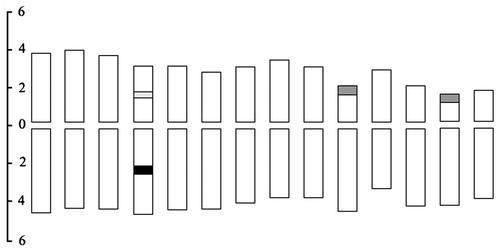
Figure 2. Idiogram of Alocasia cucullata displaying the chromosome measurements, fluorochrome bands and rDNA FISH signals. Light gray, gray and black blocks represent the 5S rDNA site, 45S rDNA site (CPD band) and DAPI+ band, respectively. The ordinate scale on the left indicates the relative length of the chromosomes.

Reprints and Corporate Permissions

Please note: Selecting permissions does not provide access to the full text of the article, please see our help page How do I view content?

To request a reprint or corporate permissions for this article, please click on the relevant link below:

Academic Permissions

Please note: Selecting permissions does not provide access to the full text of the article, please see our help page How do I view content?

Obtain permissions instantly via Rightslink by clicking on the button below:

If you are unable to obtain permissions via Rightslink, please complete and submit this Permissions form. For more information, please visit our Permissions help page.