Figures & data
Table 1. Effects of LAECV and colchicine on the frequency of mitotic abnormalities and micronuclei induction in A. cepa root apical meristem cells.
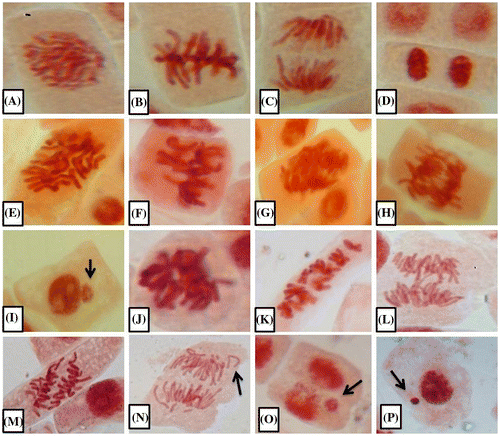
Figure 1. Photomicrographs of onion root apical meristem cells. (A–D) Normal mitotic phases: (A) prophase, (B) metaphase, (C) anaphase, and (D) telophase. (E–I) Colchicine induced abnormalities: (E) C-metaphase, (F) sticky chromosome, (G) polar deviation, (G, H) anaphase bridge, and (I) micronucleus (arrow). (J–P) LAECV induced abnormalities: (J) sticky chromosomes, (K) c-metaphase, (L) anaphase bridge, (M) polar deviation, (N) vagrant chromosome (arrow), and (O, P) micronucleus (arrows). Photomicrographs (400×) were further magnified (2×) using Microsoft Office Power Point.