Figures & data
Table 1. List of populations, voucher information, number of sampled individuals, chromosome numbers and asymmetry indexes recorded in this study.
Figure 1. Habit and flowers of Atacama (A. nivea), Mathewsia (M. incana), and Schizopetalon (S. tenuifolium).
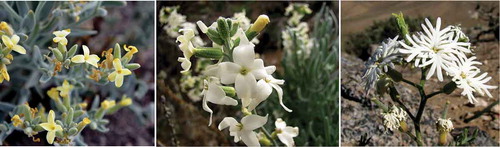
Figure 2. Distribution of analyzed species of Atacama, Mathewsia and Schizopetalon.
Figures in gray represent known localities from herbarium records. Figures in black represent sampled populations for the present study. Scale bars represent distances in km.
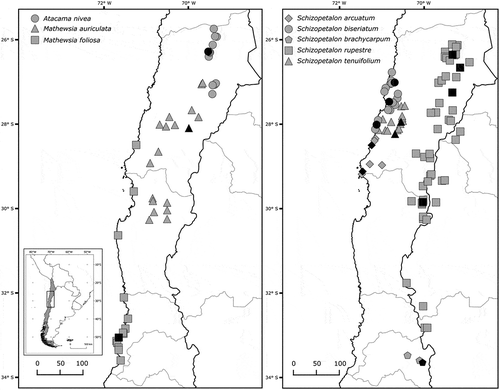
Figure 3. Metaphasic plates.
Mitotic plates observed in each analyzed taxa of this study. A: A. nivea, B: M. auriculata, C: M. foliosa, D: S. arcuatum, E: S. brachycarpum, F: S. biseriatum, G: S. tenuifolium, and H: S. rupestre. Black arrows indicate submetacentric chromosomes in Schizopetalon.
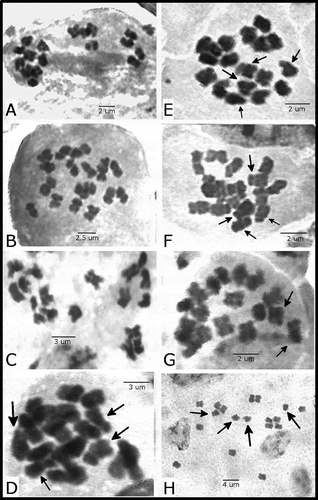
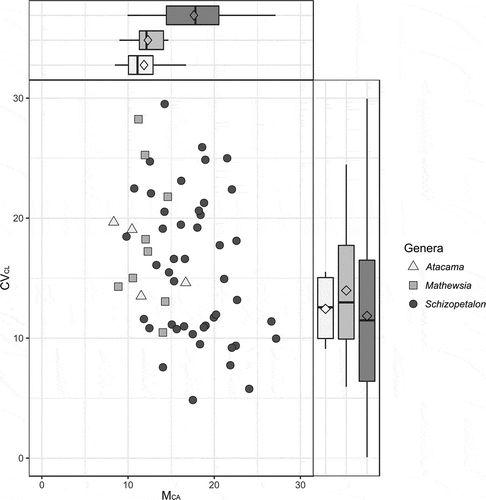
Figure 4. Asymmetry scatterplots.
Idiograms calculated using the average from the total number of mitotic plates obtained from each species analyzed of Atacama, Mathewsia and Schizopetalon. Bars in each arm represent standard deviation.
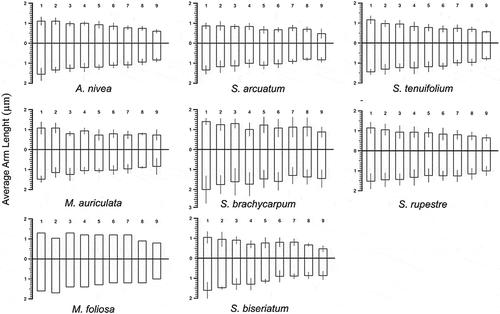
Table 2. Dunn’s test multiple comparisons for THL, CVCL and MCA indexes. All p-values are adjusted by Bonferroni correction. z:Dunn’s statistic.
Figure 5. Asymmetry indexes.