
Figures & data
Table 1. Variance analysis (ANOVA) of studied traits of Allium cepa L.
Table 2. Effect of different concentrations of urea on cytological parameters in the meristematic tissues of Allium cepa L.
Table 3. Total number of aberrant cells (cells with nuclear anomalies and cells with chromosomal aberrations) identified in meristematic tissues of Allium cepa L. treated with different urea concentrations.
Figure 1. The relative aberrant cell rate (RAR%) in meristematic tissues of Allium cepa L. treated with different urea concentrations (ppm).
Figure 2. Some chromosomal aberrations induced by exposure to different concentrations of urea in the meristematic tissues of Allium cepa L.: (a) laggard chromosome; (b, c) sticky chromosomes; (d) C-mitosis.
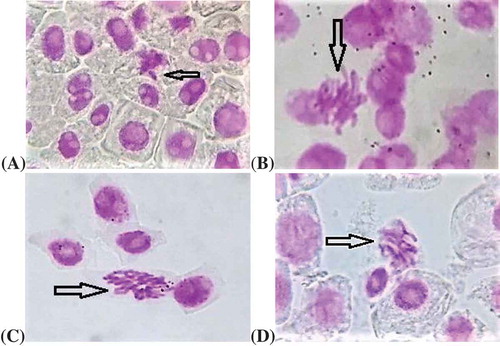
Figure 3. Some interphase nuclear anomalies induced by exposure to different concentration of urea in meristematic tissues of Allium cepa: (a) binucleated cells; (b) multinucleated cells with ghost nuclei; (c) cell with three micronuclei; (d) cell with nine micronuclei.
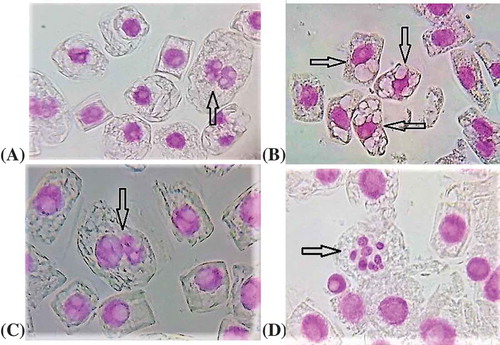
Table 4. Usual concentrations of urea in the solubilized form to the main crop plants.