
Figures & data
Table 1. Sequences of primers used for amplification of mitochondrial D-loop fragment 1(P1) and fragment 2 (P2).
Figure 1. Characterization of CoO-NPs. (A) XRD pattern of CoO-NPs. (B) Zeta potential distribution. (C) TEM imaging. (D) Size distribution by number.
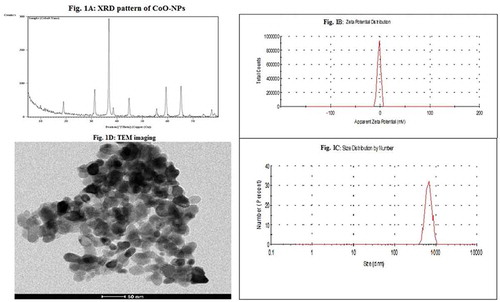
Figure 2. Pattern of mice liver, kidney and genomic DNA running on ethidium bromide stained agarose gel. Abbreviations: M: DNA marker (100 base pairs); N: negative control; O: omega-3; C: cobalt oxide nanoparticles.
Figure 3. Level of genomic DNA fragmentation in liver, kidney and testis tissues of mice orally administered CoO-XPs and/or omega-3 for three consecutive days. One-way ANOVA followed by Duncan’s test was done and statistical significance is indicated by different letters. Results are expressed as mean ± SD. Abbreviations: a: non-significant difference from the negative control group; b: significant difference from the negative control group.
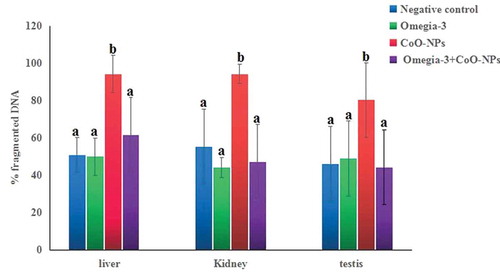
Figure 4. PCR-SSCP pattern of mitochondrial D-loop fragment 1 (Pl) and 2 (P2) in negative control group (lanes 1–2), omega-3 group (lanes 3–4), CoO-NPs group (lanes 5–6) and omega-3 plus CoO-NPs group (lanes 7–8). Mutation is indicated by arrow.
Table 2. Malondialdehyde (MDA) level and activities of catalase (CAT) and glutathione peroxidase (Gpx) enzymes in mice orally administered CoO-NPs and/or omega-3.