
Figures & data
Table 1. Data showing accession number, meiotic chromosome number, ploidy level and localities with altitude of different populations of Solanum seaforthianum from Mount Abu.
Figure 1. (a) PMC at metaphase I 12 bivalents. (b) PMC at anaphase I 12:12. (c) PMC at metaphase I showing chromosomal stickiness and unoriented bivalents. (d) PMC at anaphase I showing multiple bridges. (e) PMC showing laggards at anaphase I. (f) PMC at metaphase I with the absence of equatorial plate and bivalents are scattered in the cytoplasm. (g) PMC at anaphase I showing 24:24. (h) PMC showing spindle irregularities. (i) PMC with unequal distribution of chromosomes at anaphase I. (j) PMC showing laggards at anaphase I. (k) PMC showing laggards at anaphase II. (l) PMC showing multipolarity. (m) Dyad. (n) Triads. (o) Polyad. (p) Sterile and fertile pollen grains.
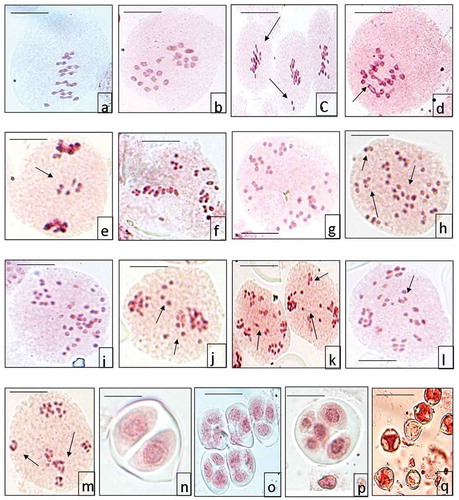
Table 2. Data on meiotic abnormalities at different stages observed in four populations of Solanum seaforthianum from Mount Abu.
Table 3. Data on abnormal microsporogenesis four different populations of Solanum seaforthianum from Mount Abu.