Figures & data
Table 1. Location and herbarium accession numbers of the studied populations of G. pyrenaicum Burm and G. pusillum L. collected by Esfandani in Iran.
Figure 1. Distribution map of the populations studied.
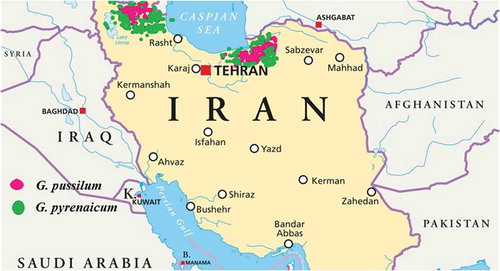
Table 2. Evaluated morphological characters.
Table 3. The main differences between G. pusillum and G. pyrenaicum.
Table 4. Evaluated characters of pollen grains in studied Geranium species.
Table 5. Fruit characters of the Geranium species.
Table 6. Seed characters of the Geranium species.
Figure 2. Multidimensional scaling plots of morphological characters, separating two Geranium species groups from each other.
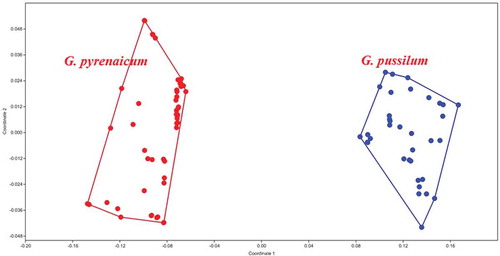
Figure 3. Pollen micrographs of Geranium species: G1–G3: G. pyrenaicum; H1–H3: G. pusillum. G1, H1: equatorial view; G2, H2: polar view; G3, H3: exine sculpture.
Figure 4. Scanning electron micrographs (SEM) of seed and fruit coat in Geranium species. (A1–A2) (C1–C2) G. pusillum; (B1–B2), (D1–D2) G. pyrenaicum.
Figure 5. MDS plot of morphological characters in G. pyrenaicum populations studied. Different colors indicate the plant specimens (numbers 1–8) studied from each geographical population.
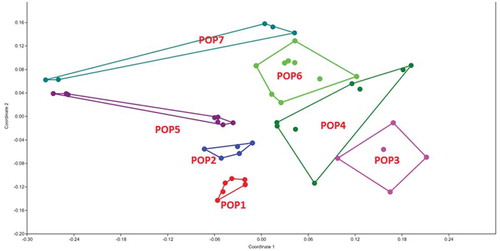
Table 7. Genetic diversity parameters in the studied populations. (N = number of samples, Ne = number of effective alleles, I = Shannon information index, He = gene diversity, UHe = unbiased gene diversity, P% = percentage of polymorphism, populations).
Figure 6. MDS plot of ISSR data in G. pyrenaicum populations studied.
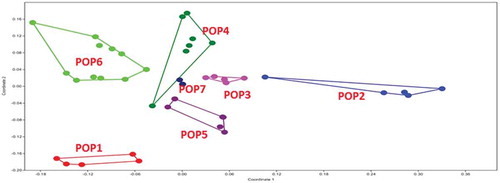
Figure 7. STRUCTURE plot and neighbor-net network of G. pyrenaicum populations based on k = 6 of ISSR data.
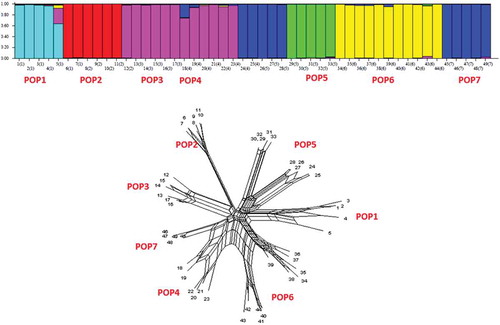
Figure 8. MDS plot of morphological characters in G. pusillum populations studied. Different colors indicate the plant specimens (numbers 1–8) studied from each geographical population.
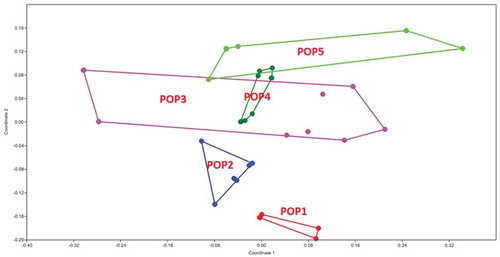
Table 8. Genetic diversity parameters in the studied populations. (N = number of samples, Ne = number of effective alleles, I = Shannon information index, He = gene diversity, UHe = unbiased gene diversity, P% = percentage of polymorphism, populations).
Figure 9. MDS plot of ISSR in G. pusillum populations studied. Different colors indicate the plant specimens (numbers 1–8) studied from each geographical population.
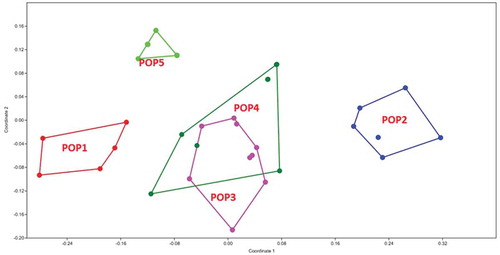
Figure 10. (a) Reticulogram, (b) STRUCTURE plot, (c) neighbor-net network of G. pyrenaicum populations based on k = 3 of ISSR data.
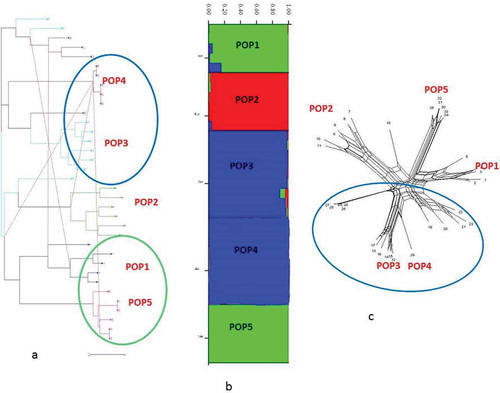
Figure 11. Consensus tree of morphological and molecular data in G. pusillum populations.