Figures & data
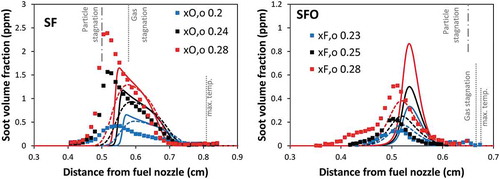
Figure 1. Calculated temperature profiles of SF flames (left panel) and SFO flames (right panel). Dashed lines: model neglecting radiative heat losses. Solid lines: model including radiative heat losses.
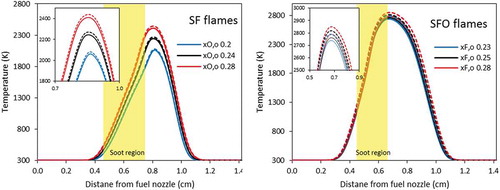
Figure 2. Comparison of soot volume fraction profiles between experimental data (symbol) and model (lines) of SF flames (left panel) and SFO flames (right panel). Dashed lines: model neglecting radiative heat losses. Solid lines: model including radiative heat losses.
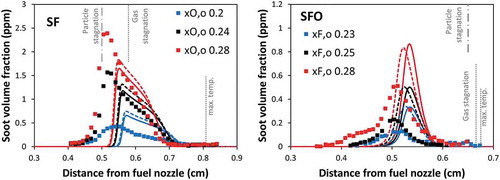
Figure 3. Comparison of soot volume fraction profiles between experimental data (symbol) and model (lines) of SF flames (left panel) and SFO flames (right panel). Dashed lines: model neglecting soot oxidation. Solid lines: model including soot oxidation.
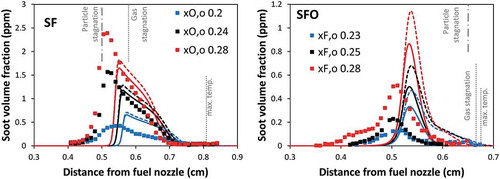
Figure 4. Mass loss rate of particle oxidation by different oxidizers.
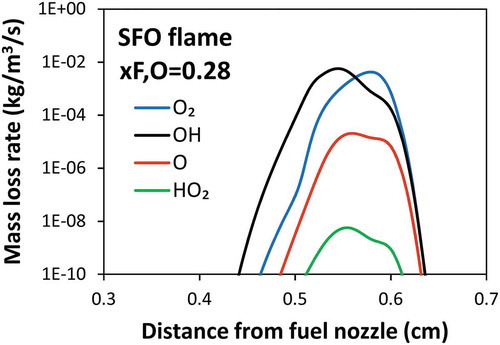
Figure 5. Comparison of soot volume fraction profiles between experimental data (symbol) and model (lines) of SF flames (left panel) and SFO flames (right panel). Dashed lines: model neglecting thermophoretic effect. Solid lines: model including thermophoretic effect.
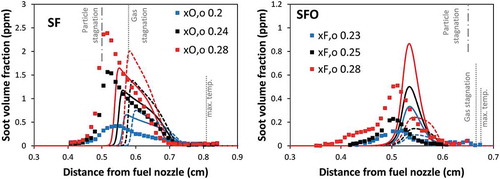
Figure 6. Diffusion coefficient of lumped pseudo species respect to molecular weight.
Figure 7. Comparison of soot volume fraction profiles between experimental data (symbol) and model (lines) of SF flames (left panel) and SFO flames (right panel). Dashed lines: model accounting particle diffusivity from gas kinetic theory. Solid lines: model accounting particle diffusivity from Stoke-Cunningham correlation.