Figures & data
Figure 1. Schematic illustration of the DNS steps followed for the non-premixed MILD combustion of methane and air diluted with recirculated exhaust gases (from Doan et al. (Citation2018)).
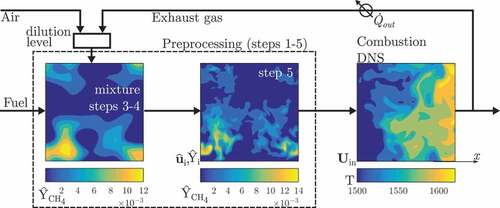
Table 1. Oxidizer composition for the initial MILD mixture.
Table 2. MILD combustion DNS initial conditions.
Table 3. Conditions of additional DNS data used for numerical schlieren analysis.
Figure 2. Volume rendered temperature field of (a) conventional turbulent premixed combustion, Case P1, and (b) MILD combustion of Case AZ1.
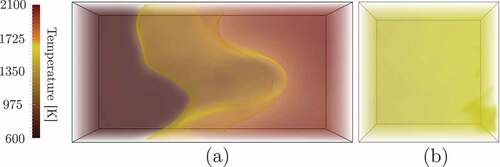
Figure 3. Contours of (a) heat release rate, (b) and (c)
in the mid
–
plane at
in case AZ1.
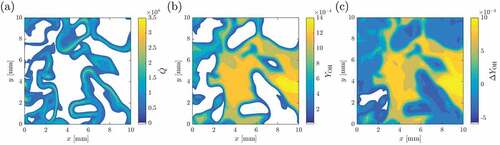
Figure 4. Pdf of from Case AZ1 at
.
Figure 5. Contours of (a) , (b)
, (c)
, (d)
, (e)
and (f)
in the mid
–
plane for case AZ1 at
. Dark to light gray lines are for iso-contours of values 0.1, 0.2, .., 0.9.
Figure 6. Scatter plots of normalized heat release rate vs (a) , (b)
, (c)
, (d)
, (e)
and (f)
for case AZ1 obtained using the data shown in . Points are colored by their streamwise locations.
![Figure 6. Scatter plots of normalized heat release rate vs (a) [OH∗]˜, (b) SOH˜, (c) SCH2O˜, (d) SH˜, (e) SHCO˜ and (f) SOH×SCH2O˜ for case AZ1 obtained using the data shown in Figure 5. Points are colored by their streamwise locations.](/cms/asset/a6196f21-9e44-4be4-9aa4-bf10ddeb45b4/gcst_a_1610746_f0006_oc.jpg)
Table 4. Pearson correlation coefficients for the -
scatter plots.
Figure 7. Volume rendered images of normalized (a) heat release rate, , and (b)
for the case AZ1.
![Figure 7. Volume rendered images of normalized (a) heat release rate, Q˙˜, and (b) [OH∗]˜ for the case AZ1.](/cms/asset/1548e6bb-7109-4af7-87e2-eefe7dd448f8/gcst_a_1610746_f0007_b.gif)
Figure 8. Variations of (in a,c) and
(b,d) in the mid
–
plane for cases AZ1 (a,b) and BZ1 (c,d) at
. The results are shown for regions with
.
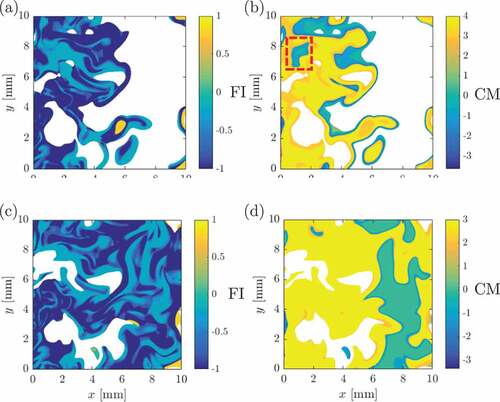
Figure 9. Joint-pdf of (,
) in regions with
and
for cases (a) AZ1 and (b) BZ1 using samples collected in the mid
–
plane at
shown in .
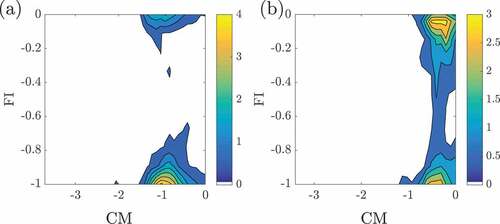
Figure 10. Numerical schlieren for the premixed cases (a) P1 and (b) P2, (c) premixed MILD combustion case P3 and the non-premixed MILD combustion cases (d) AZ1, (e) AZ2 and (f) BZ1. Axes for cases P1 and P2 are normalized by their respective laminar flame thicknesses.
Figure 11. Numerical schlieren image for the data in the mid –
plane of the (a) MILD combustion case AZ1 and (b) premixed combustion case P2. The iso-lines show the normalized heat release rate (white dotted line is for 0.2, dashed line is for 0.5, dash-dotted line is for 0.7 and solid line is for 0.9).