Figures & data
Figure 1. Experimental conditions of soot and species measurements for fuel-rich CH4 combustion near atmospheric pressure operated by various methods: burner stabilized flames (Ahmed et al. Citation2016; Alfè et al. Citation2010; Castaldi, Vincitore, Senkan Citation1995; Li et al. Citation2012; Marinov et al. Citation1996; Melton, Vincitore, Senkan Citation1998; Xu and Faeth Citation2000); jet-stirred reactor (Le Cong and Dagaut Citation2008); plug-flow reactors (Köhler et al. Citation2016; Skjøth-Rasmussen et al. Citation2004); and a micro flow reactor with a controlled temperature profile (this study).
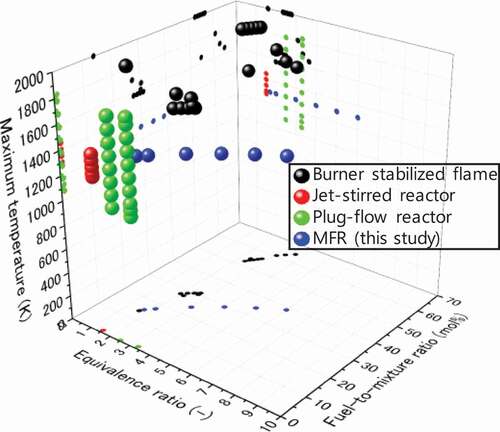
Figure 2. Schematic and direct image (Dubey et al. Citation2016) of flame and soot observation in MFR.
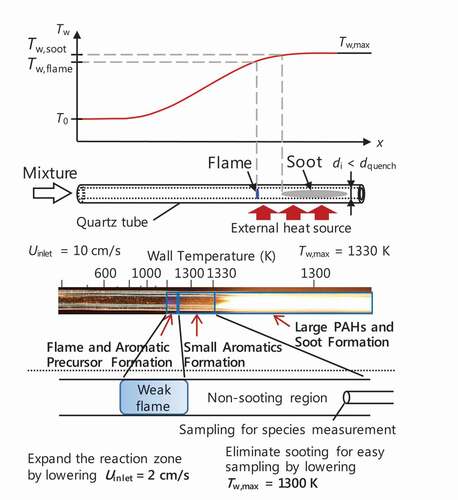
Figure 3. Benzene production as a function of maximum wall temperature at Ø = 6.0 in MFR. See following sections for experimental and computational methods.
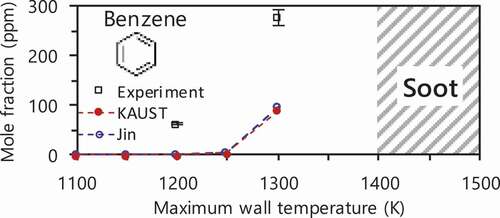
Figure 4. Schematic of experimental setup. The temperature profile shown in the figure was measured in experiments and used in computations.
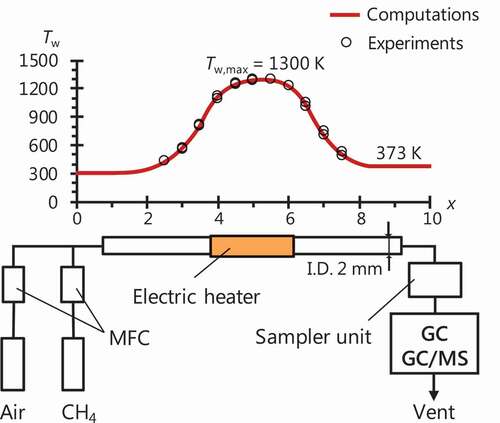
Figure 5. Measured (open square) and computed (circle with line) mole fractions of O2, H2, C1–C2 and aromatic species for CH4/air mixtures at Ø = 1.7–6.0 (fuel-to-mixture ratio of 15–38 mol.%) and Tw,max = 1300 K.
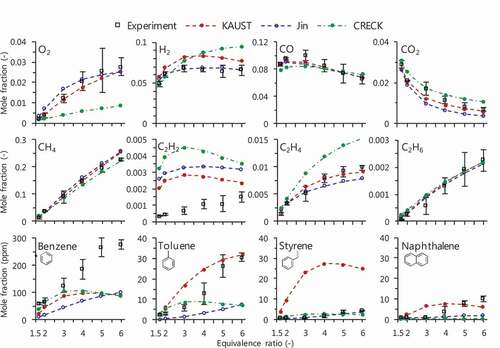
Figure 6. C2H2 prediction performed by various chemical kinetics: KAUST (Selvaraj et al. Citation2016), Jin (Jin et al. Citation2017) and CRECK (CRECK Modeling Group, Politecnico di Milano Citation2014) as mechanisms including PAH growth; AramcoMech 1.3 (Metcalfe et al. Citation2013), San Diego mechanism (Citation2016) (San Diego Mechanism web page, University of California at San Diego Citation2016), HP-Mech (Yang et al. Citation2017) and FFCM-1 (Smith, Tao, Wang Citation2016) as non-PAH mechanisms. Black long broken line shows the mole fraction of measured benzene by a factor of 3.
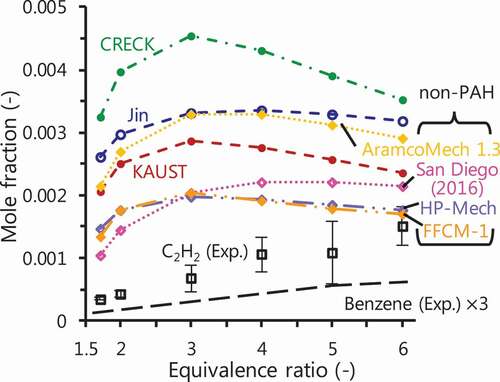
Figure 7. First order, A-factor sensitivity coefficients for C2H2 mole fraction at Ø = 1.7, 4.0 and 6.0 performed with (a) Jin and (b) HP-Mech. Top 10 sensitive reactions at location of maximum rate of C2H2 production for each condition are shown.
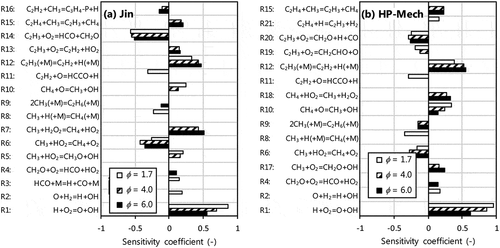
Table 1. Reactions of C2H3 +O2=products included in the mechanisms
Figure 8. Reaction pathways of benzene formation analysed with (a) KAUST and (b) Jin at a maximum rate of benzene production, and Ø = 2.0 and 6.0. Numbers in parenthesis are percent contribution to production of benzene, toluene and styrene. The measured species are shown in boxes.
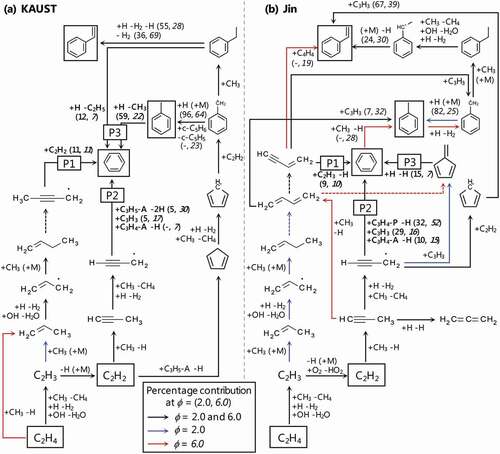
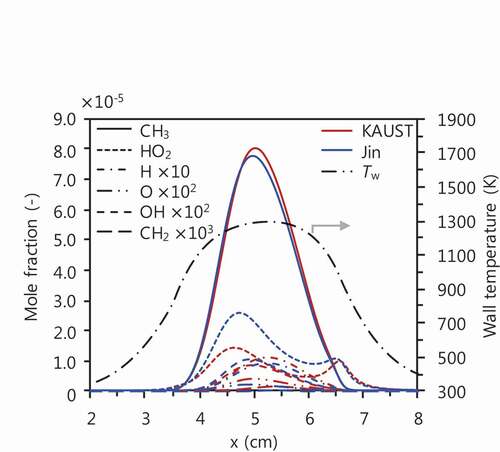
Figure 9. Profiles of typical radicals for CH4/air mixtures at Ø = 6.0 computed with KAUST (red lines) and Jin (blue lines).