Figures & data
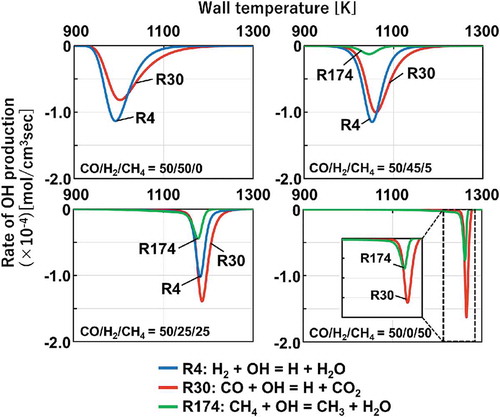
Figure 1. (a) Combustion conditions of conventional diesel engines and in-cylinder fuel reforming engines described onɸ-T diagram (Kamimoto, Citation1988; Akihama, Citation2014) and (b) A conceptual scheme of in-cylinder fuel reforming engine
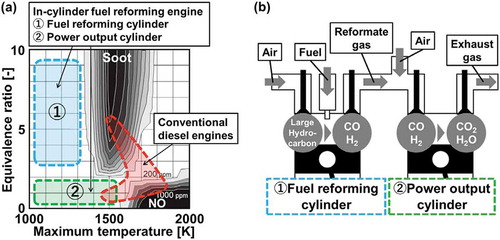
Figure 2. (a) Computed mole fractions of CO, H2, CH4 and C2H4 produced in fuel reforming of n-tridecane/air mixtures after one cycle of piston compression-expansion strokes in an engine cylinder at adiabatic condition (Murakami, Citation2017) and (b) Computed maximum gas temperatures during the fuel reforming process
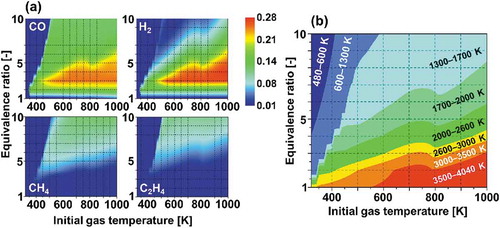
Figure 3. A ternary diagram indicating mixture conditions experimentally investigated for the reactivity of CO2/CH4 mixtures in the present and earlier studies (Gersen, Citation2012; Mathieu, Citation2013, Citation2015; Mansfield, Citation2015; Liu, Citation2018)
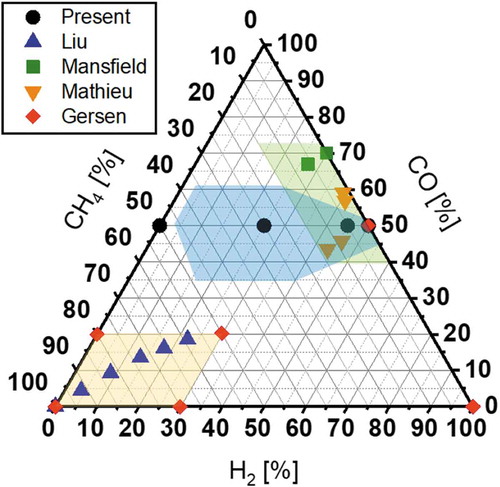
Figure 4. Schematic of a micro flow reactor with a controlled temperature profile
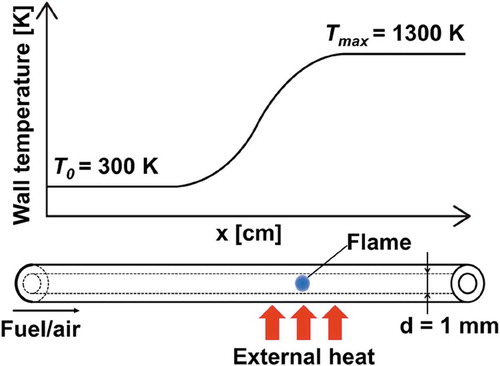
Table 1. Mole fractions of mixture components investigated in the present study. Shaded conditions indicate the mixtures considered in both experiments and computations. Non-shaded conditions indicate the mixtures considered only in computations
Figure 5. Normalized fractions of CO, H2 and CH4 plotted along equivalence ratio conditions for in-cylinder fuel reforming at 530 K (the initial gas temperature for in-cylinder fuel reforming)
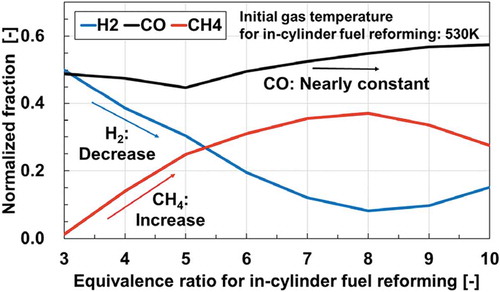
Figure 6. The measured wall temperatures of the reactor and the estimated wall temperature profile used in the computation
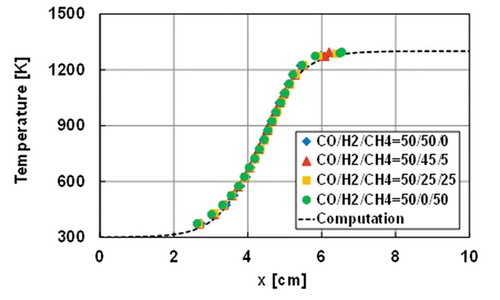
Figure 7. Weak flame images of CO/H2/CH4 = 50/50/0, 50/45/5, 50/25/25 and 50/0/50 obtained in the experiment
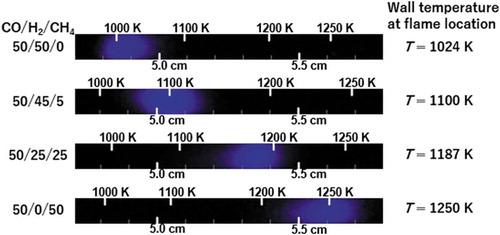
Figure 8. Comparison of weak flame locations of the stoichiometric CO/H2/CH4 mixtures between the experimental measurements (Black plots) and the computational predictions (Colored lines). The uncertainty of the wall temperature at a flame location is less than 5 K
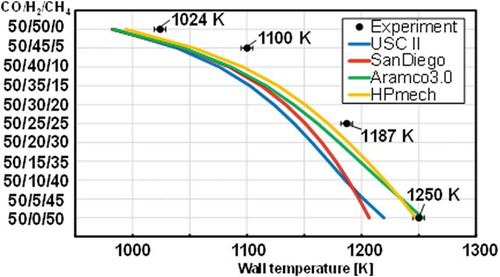
Figure 9. Computed ignition delay times of stoichiometric CO/H2/CH4/air mixtures at atmospheric pressure and initial temperatures of 800-1600 K by HPmech
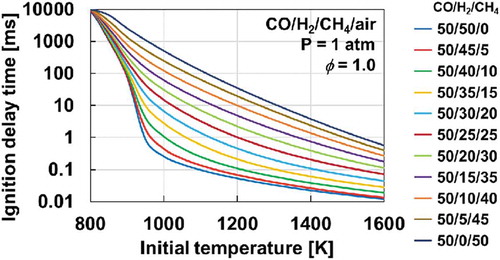
Figure 10. Rate of OH production for the cases of CO/H2/CH4 = 50/50/0, 50/45/5, 50/25/25 and 50/0/50. (Negative value indicates consumption.)