Figures & data
Table 1. Proximate and ultimate analysis of wood fuel.
Figure 1. Measured mass (kg) and derived fuel conversion rate (kg/h) during the combustion of: (a) low moisture and (b) high moisture fuel. Solid vertical lines represent the point of reloading. Dashed vertical lines represent transfer from flaming to smoldering phase.
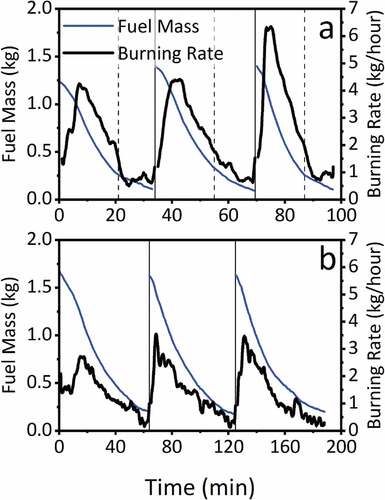
Table 2. Combustion zone temperatures.
Figure 2. Gaseous emission concentrations (mg/m3) for (a) low moisture wood and (b) high moisture wood. Solid vertical lines represent the point of reloading. Dashed vertical lines represent the point of transfer from the flaming phase to the smoldering phase.
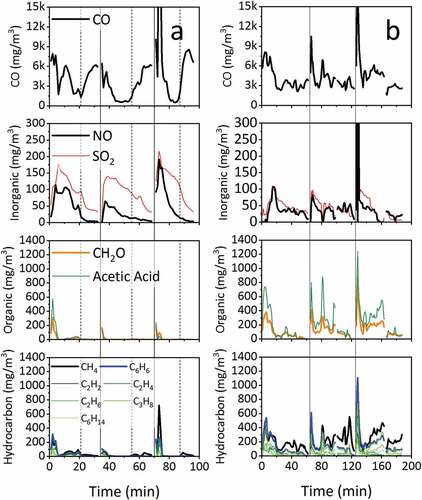
Table 3. Average emission factors evaluated over complete combustion cycles for low and high moisture wood in g/kg (dry basis).
Table 4. Concentration of organic compounds sampled in the condensate.
Table 5. Soot particle size distribution (by mass fraction).
Table 6. Elemental Carbon, Organic Carbon and Total Carbon composition of the soot samples presented on a weight percent basis (wt. %).
Table 7. Published data from (Jones et al. Citation2020) on optical properties and MCE.
Figure 3. SEM images of soot collected by impaction from low moisture wood (a, b) showing long chains of spherical particulate material (high EC/TC) and high moisture wood (c, d) showing the formation of amorphous tar-like material (high OC).
Figure 4. Chromatogram of the Py-GC-MS of species desorbed at 300oC from the ‘raw tar’ collected from the combustion of High Moisture wood showing the sugar hydrides, oxidized species and polyphenol species: 1, methoxy-toluenes; 2, methoxy-phenols; 3, guaiacyl acetone;4, 1-(3,4,5-trimethoxyphenyl)ethenone; 5, levoglucosan, d-glucopyranose, anhydro-d-mannosan; 6, Syringaldehyde; 7, acetosyringone, acetophenone.
Figure 5. Normalized Raman spectra of soot from the combustion of low and high moisture woods.
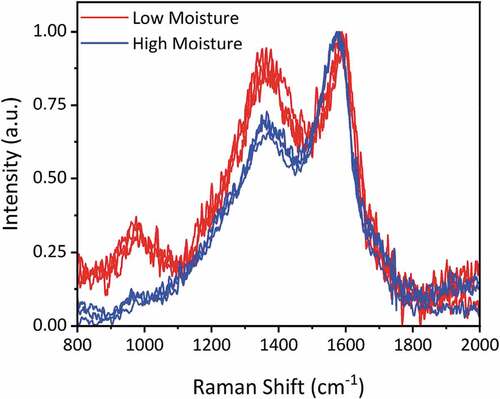
Table 8. Relationship of OC fraction to ID/IG value.
Table 9. Soot characteristics from low and high moisture wood.
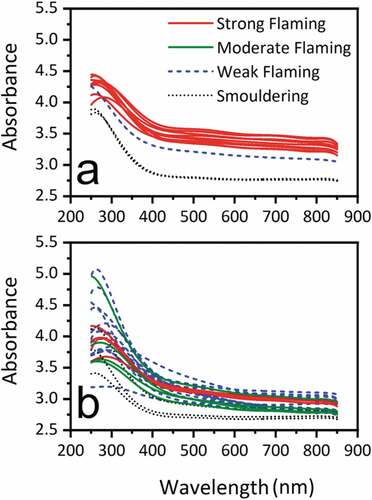
Figure 6. UV Vis results for: (a) low moisture wood and (b) high moisture wood.