
Figures & data
Figure 1. Aerosol surrounded by cloud of pyrolysis gas.
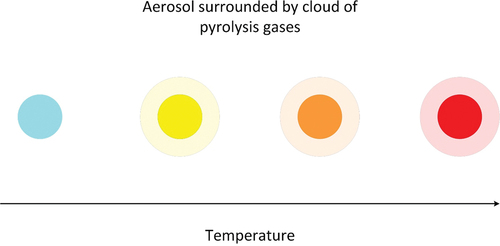
Figure 2. Reactor Gas to be admitted to the GC-MS Heat exchanger to condense heavy hydrocarbons and tar, Sampling valve, Pressure indicator, Purging valve, Reactor installed inside the tubular furnace, Purging valve
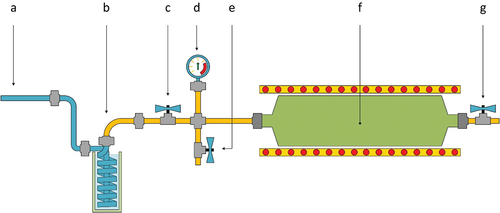
Figure 3. TGA analysis of samples conducted in an air environment.
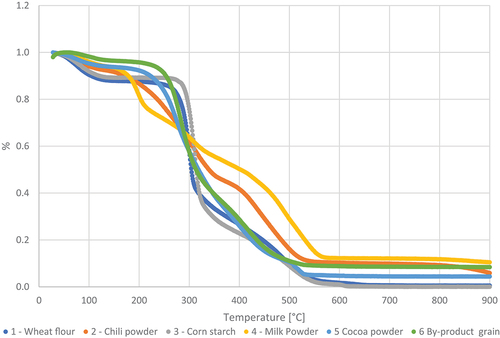
Figure 4. TGA analysis of samples conducted in a nitrogen environment.
Figure 5. Pyrolysis gases from wheat flour. The formation of gases as function of temperature.
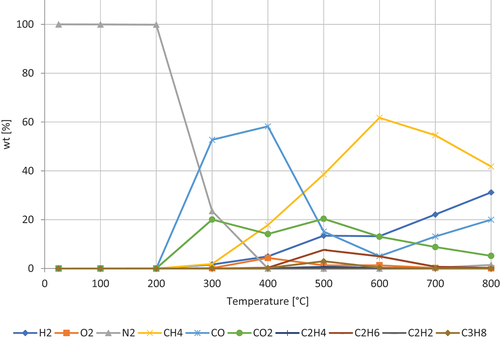
Figure 6. Pyrolysis gases from chili powder. The formation of gases as function of temperature.
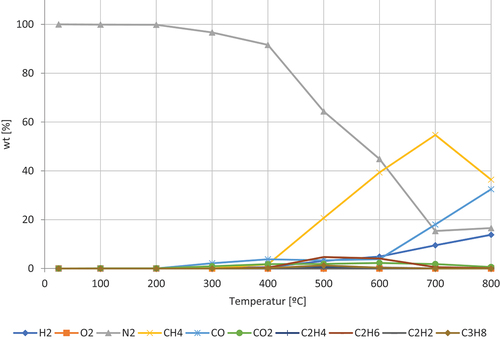
Figure 7. Pyrolysis gases from corn starch. The formation of gases as function of temperature.
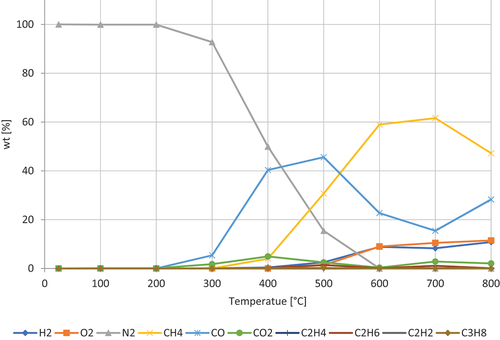
Figure 8. Pyrolysis gases from dried milk powder. The formation of gases as function of temperature.
Figure 9. Pyrolysis gases from cocoa powder. The formation of gases as function of temperature.
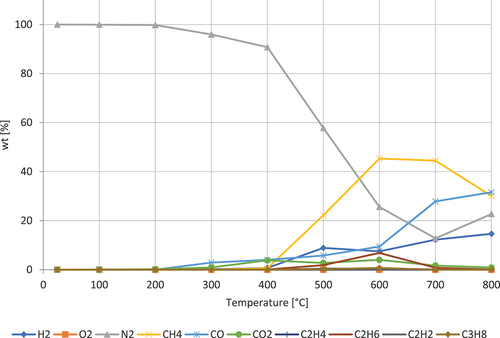
Figure 10. Pyrolysis gases from by-product of grain. The formation of gases as function of temperature.
Table 1. Constants for calculating the concentration of methane and hydrogen.
Table 2. Constants for calculating the concentration of carbon monoxide.
Table 3. Constants for calculating the concentration of carbon dioxide.