Figures & data
Figure 1. Flow chart for mechanism reduction.
Figure 2. Comparison of ignition delay times calculated using the 36-species skeletal and high- part of the comprehensive (Zhang et al. Citation2016) mechanisms. Results for the skeletal mechanisms of Ra and Reitz (Citation2008) and Liu et al. (Citation2012) are also shown. Experimental data is from Ciezki and Adomeit (Citation1993) and Shen et al. (Citation2009)
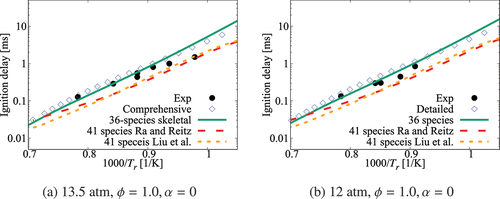
Figure 3. Comparison of ignition delay times calculated using the 36-species skeletal and high- part of the comprehensive (Zhang et al. Citation2016) mechanisms. Results for the skeletal mechanisms of Ra and Reitz (Citation2008) and Liu et al. (Citation2012) are also shown. Experimental data is from Gauthier, Davidson, and Hanson (Citation2004) and Ciezki and Adomeit (Citation1993)
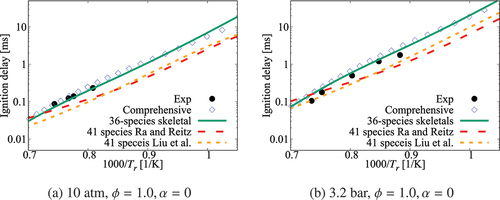
Figure 4. Comparison of ignition delay times calculated using the 36-species skeletal and high- part of the comprehensive (Zhang et al. Citation2016) mechanisms along with those for the skeletal mechanisms of Ra and Reitz (Citation2008) and Liu et al. (Citation2012). Experimental data is from Campbell et al. (Citation2015)
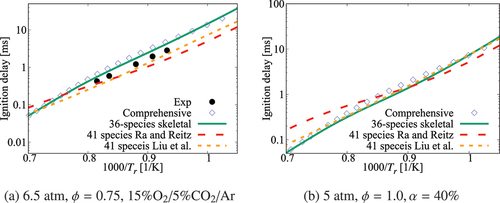
Figure 5. Comparison of ignition delay times calculated using the 36-species skeletal (symbols) and comprehensive (lines) mechanisms for 1 atm and
-heptane/air mixture with various dilution levels. Solid line and squares are for no dilution, dashed line and circles are for
dilution, dotted line and stars are for
dilution, dash-dotted line and triangles are for
dilution.
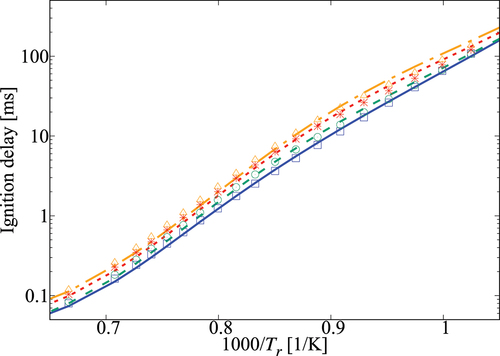
Figure 6. Comparison of ignition delay times calculated using the 36-species skeletal (symbols) and comprehensive (lines) mechanisms for 5 atm and
-heptane/air mixture with various dilution levels. Solid line and squares are for no dilution, dashed line and circles are for
dilution, dotted line and stars are for
dilution, dash-dotted line and triangles are for
dilution.
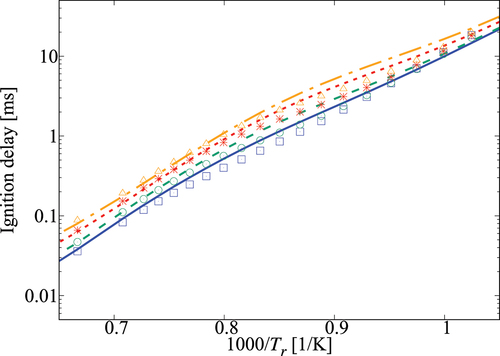
Figure 7. Comparison of ignition delay times calculated using the 36-species skeletal (symbols) and comprehensive (lines) mechanisms for 10 atm and
-heptane/air mixture with various dilution levels. Solid line and squares are for no dilution, dashed line and circles are for
dilution, dotted line and stars are for
dilution, dash-dotted line and triangles are for
dilution.
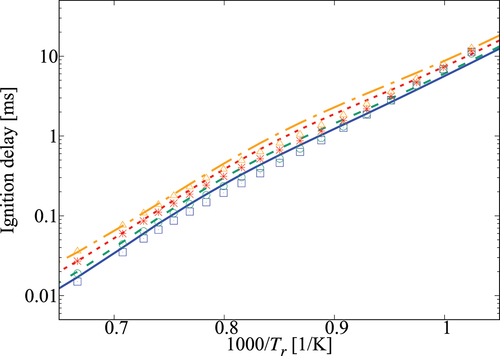
Table 1. Percentage error in computed using the 36-species skeletal mechanism in comparison to that obtained using the comprehensive mechanism.
Figure 8. Typical reaction sensitivity for ignition delay time at 1 and 10 atm with .
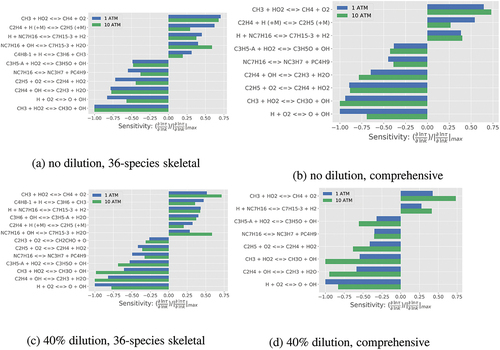
Figure 9. Comparison of laminar flame speeds computed using various mechanisms with measurement at 1/5/10 atm, K and
.
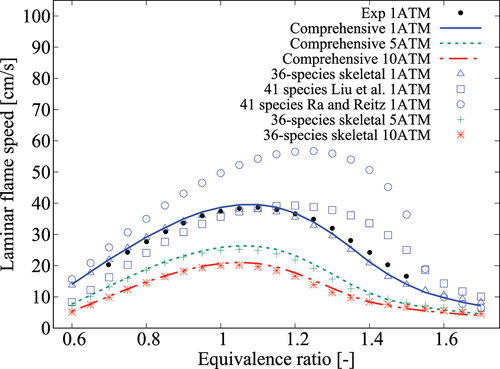
Figure 10. Comparison of laminar flame speeds computed using various mechanisms with measurements of Dirrenberger et al. (Citation2014) for 1 atm, K and
.
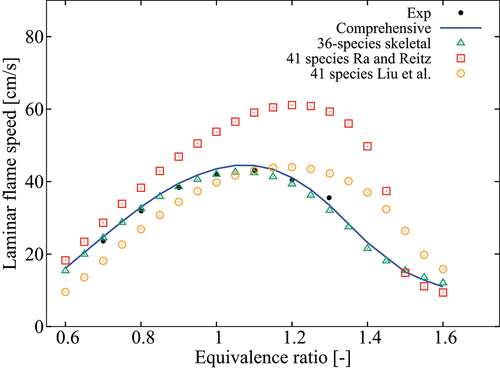
Figure 11. Comparison of computed laminar flame speeds with measurements from Kelley et al. (Citation2011) for 2 atm, K and
.
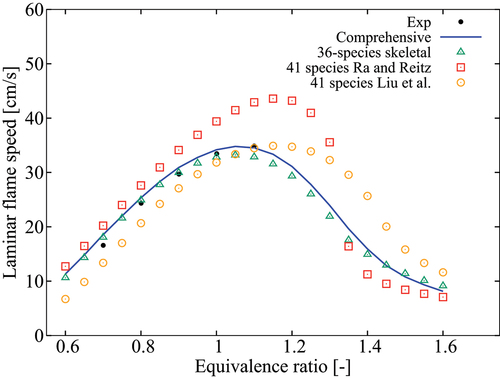
Figure 12. Comparison of computed laminar flame speeds with measurements from Kelley et al. (Citation2011) for 5 atm, K and
.
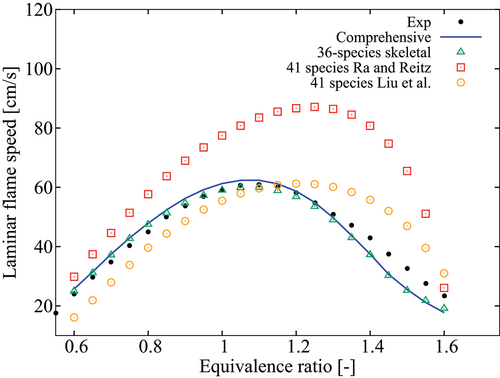
Figure 13. Comparison of laminar flame speeds obtained using 36-species skeletal (symbols) and comprehensive (lines) mechanisms. Solid line and squares are for 1 atm, dashed line and circles are for 5 atm, and dotted line and triangles are for 10 atm. The flame speed values for with
and
dilutions are shifted up by 20 cm/s for clarity.
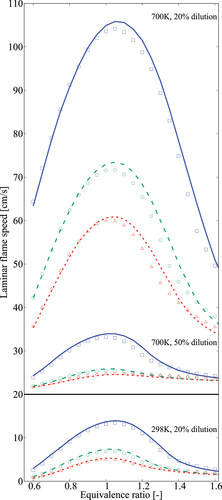
Figure 14. Comparison of OH* and CH* levels obtained using the comprehensive mechanism (solid lines) and QSSA with 36-species skeletal mechanism (dashed lines) for K.
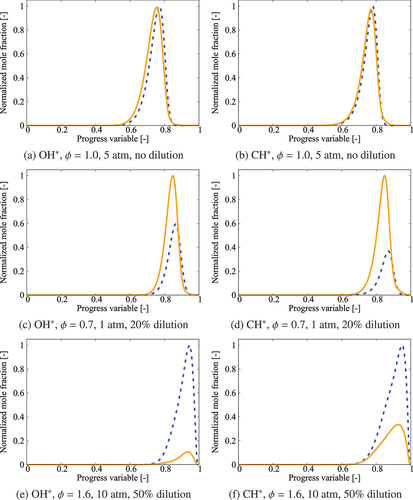
Figure 15. The variations of absolute percentage difference in the locations of peak values of OH* and CH* computed using the skeletal and comprehensive mechanisms for various values of ,
, and
.
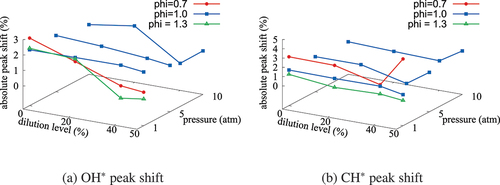
Figure 16. Two-dimensional schematic for the computational domain with boundary conditions used for the JHC burner of Li et al. (Citation2021a)
Table 2. Jet and coflow characteristics.
Figure 17. Comparison of computed and measured mean temperature variations at four axial locations. Coflow oxygen level is 3%. The results of Li et al. (Citation2021a) are also shown for comparison.
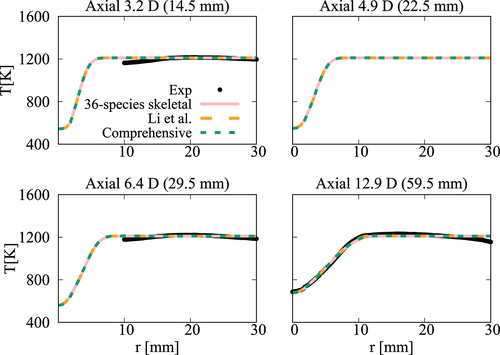
Figure 18. Comparison of computed and measured mean number density of OH at four axial locations. Coflow oxygen level is 3%. The results of Li et al. (Citation2021a) are shown for comparison.
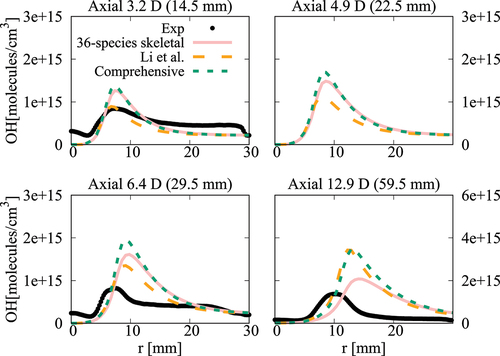
Figure 19. Comparison of computed and measured mean temperature variations at four axial locations. Coflow oxygen level is 6%. The results of Li et al. (Citation2021a) are also shown for comparison.
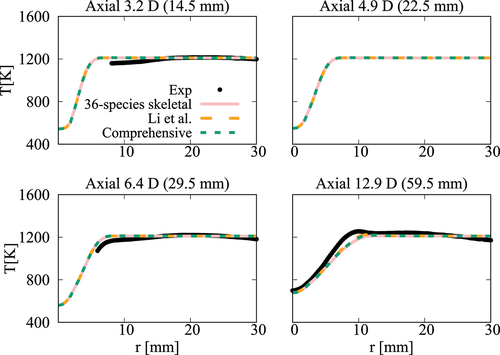
Figure 20. Comparison of computed and measured mean number density of OH at four axial locations. Coflow oxygen level is 6%. The results of Li et al. (Citation2021a) are shown for comparison.
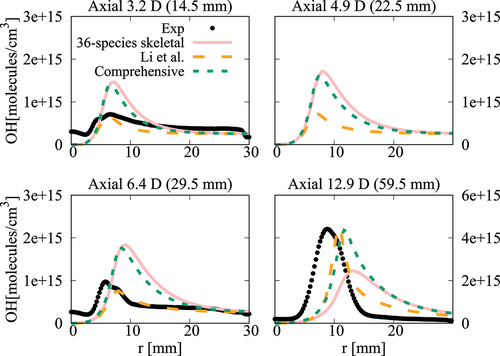
Figure 21. Comparison of computed and measured mean temperature variations at four axial locations. Coflow oxygen level is 6%. The results of Li et al. (Citation2021a) are also shown for comparison.
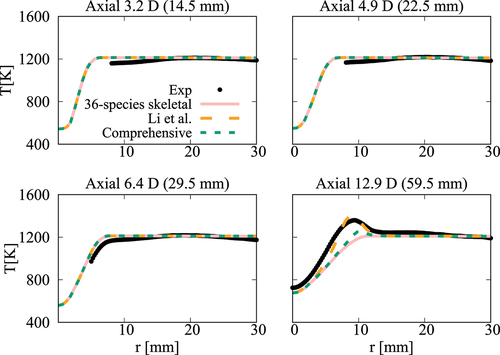
Figure 22. Comparison of computed and measured mean number density of OH at four axial locations. Coflow oxygen level is 9%. The results of Li et al. (Citation2021a) are shown for comparison.
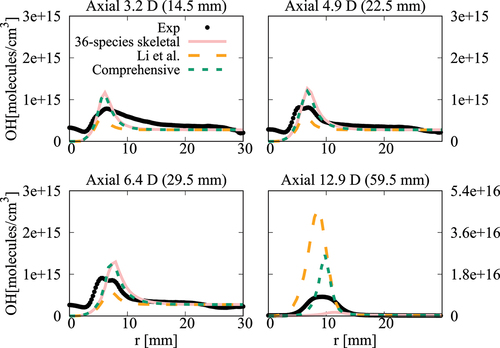
Figure A1. Comparison of ignition delay times calculated using comprehensive mechanisms from Zhang et al. (Citation2016) and Curran et al. (Citation1998, Citation2002) for cases without dilution.
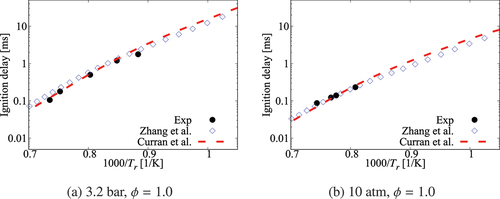
Figure A2. Comparison of ignition delay times calculated using comprehensive mechanisms from Zhang et al. (Citation2016) and Curran et al. (Citation1998, Citation2002) for case under 6.5 atm, , mixture composition n-heptane/15%O2/5%CO2/Ar.
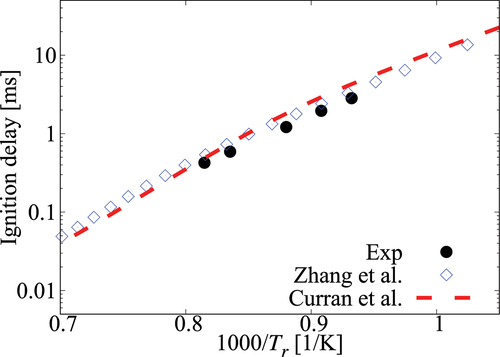
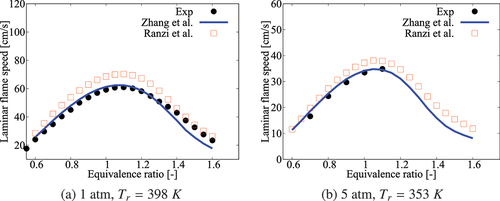
Figure A3. Comparison of laminar flame speeds calculated using comprehensive mechanisms from Zhang et al. (Citation2016) and Curran et al. (Citation1998, Citation2002) for cases without dilution.
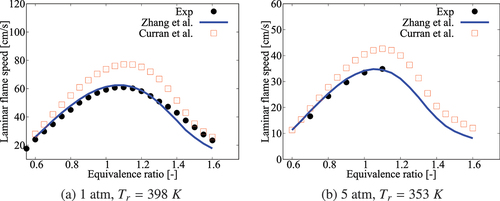
Figure A4. Comparison of ignition delay times calculated using comprehensive mechanisms from Zhang et al. and Ranzi et al. for cases without dilution.
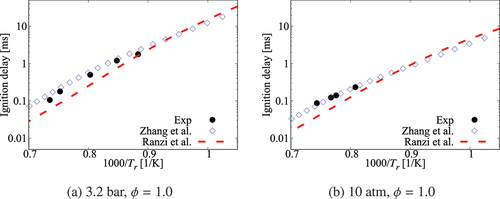
Figure A5. Comparison of ignition delay times calculated using comprehensive mechanisms from Zhang et al. and Ranzi et al. for case under 6.5 atm, , mixture composition n-heptane/15%O2/5%CO2/Ar.
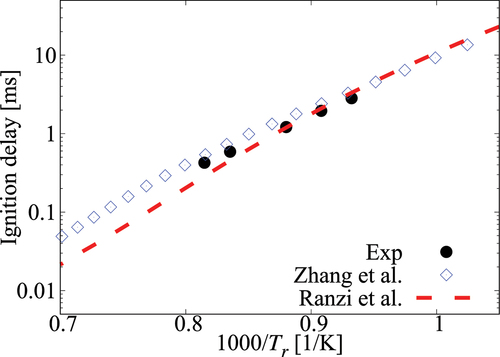
Figure A6. Comparison of laminar flame speeds calculated using comprehensive mechanisms from Zhang et al. and Ranzi et al. for cases without dilution.