Figures & data
Table 1. Thermo-physical properties of liquid n-heptane and water.
Table 2. Simulation parameters for different cases: fuel droplet initial diameter , water droplet initial diameter
, overall water loading
. The p. means premixed, h. means heptane, d. means droplets and w. means water. These abbreviations are used throughout this work.
Figure 1. Iso-surface of progress variable (
column) and temperature
(
column) taken at
and
for premixed combustion (
row) and spray combustion (
row) at
. In all cases, the water droplet size is
. The light blue dots are water droplets, while the red dots indicate n-heptane droplets (not to the scale).
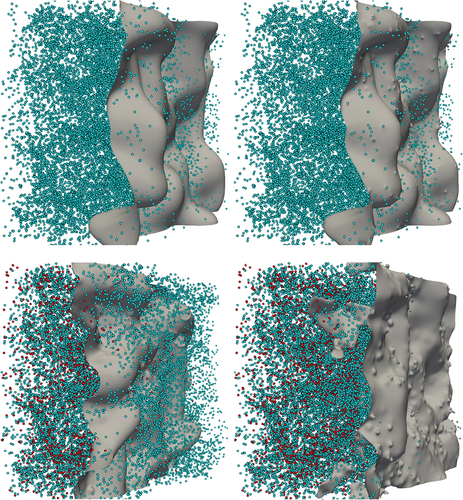
Figure 2. Temperature field on the
mid-plane, for premixed combustion (left column) and spray combustion (right column) cases without water injection (
row), with
(
row) and
(
row). The white dots are the n-heptane droplets, while the pink dots indicate the water droplets (not to the scale). White iso-contours represent
,
and
, respectively. The results are taken at
.
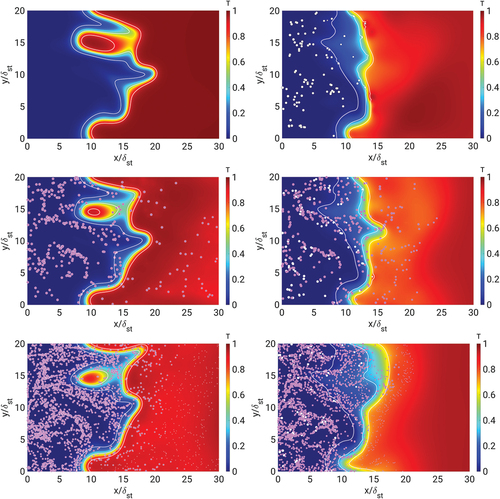
Figure 3. Water vapour fields on the
mid-plane, for premixed combustion (
column) and spray combustion (
column) cases with
(
row) and
(
row). The white dots are the n-heptane droplets, while the pink dots indicate the water droplets (not to the scale). White iso-contours represent
,
and
, respectively. The results are taken at
.
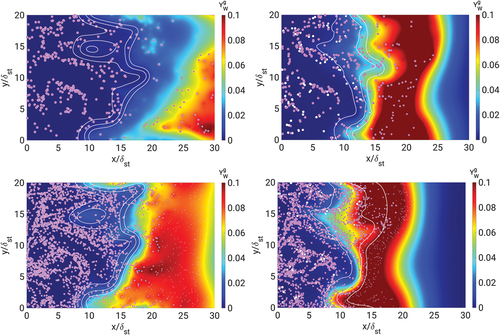
Figure 4. Time evolution of water vapour concentration within the flame (
) for the cases with water injection. Water droplet size
(left side) and
(right side).
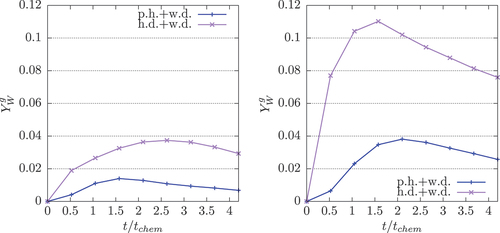
Figure 5. Turbulent burning velocity evolution in time, with
(left side) and
(right side).
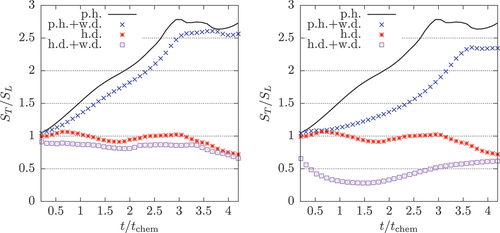
Figure 6. Evolution of normalised burning rate per unit area , with
(left side) and
(right side).
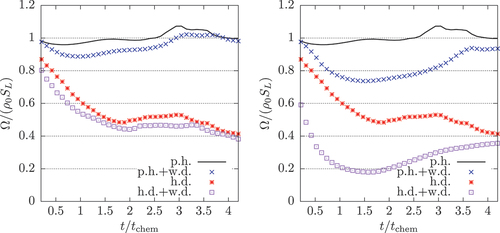
Figure 7. Evolution of the relative burning velocity , with
(left side) and
(right side).
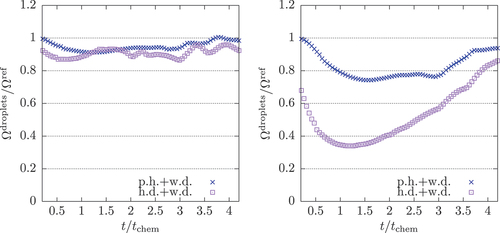
Figure 8. Flame thickness evolution, with
(left side) and
(right side).
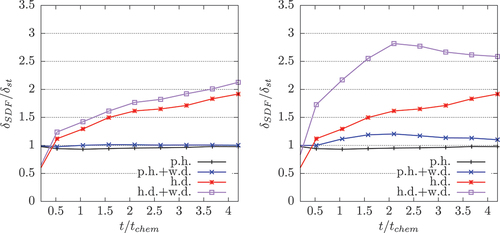
Figure 9. Surface density function conditioned on progress variable
, with
(left side) and
(right side). Statistics are taken at
.
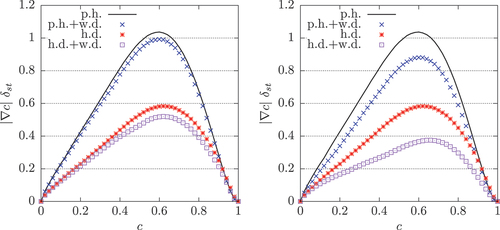
Figure 10. Evolution of flame area based on progress variable
, with
(left side) and
(right side).
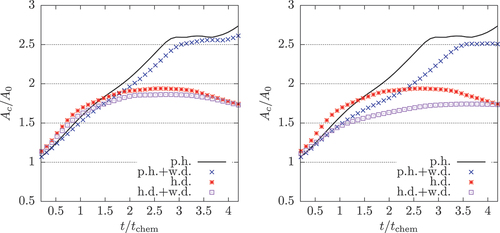
Figure 11. Evolution of flame area based on temperature
, with
(left side) and
(right side).
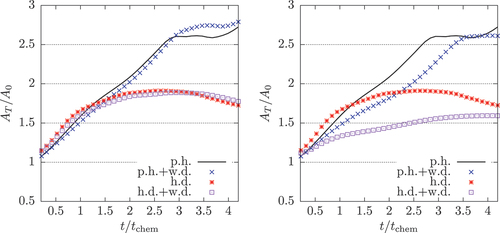
Figure 12. Probability density function of gaseous equivalence ratio inside the flame (
) for the spray combustion cases at
, with
(left side) and
(right side).
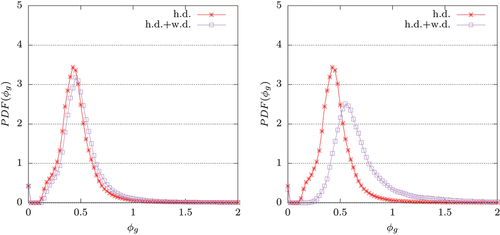
Figure 13. Probability density function of the gaseous equivalence ratio inside the flame (
) for the laminar spray combustion cases at
, with
(left side) and
(right side).
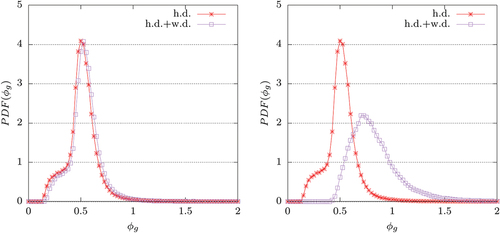
Figure 14. Percentage of heat release nature HR (left side) and combustion mode
FI in the region given by
(right side) for all spray combustion cases, at
. The L indicates laminar conditions.
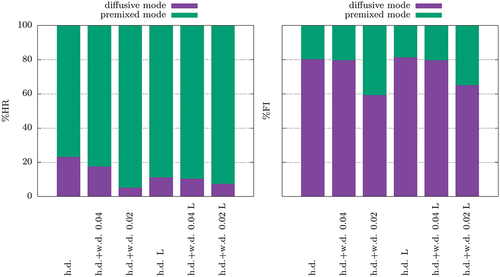
Table 3. Flame thickness , flame brush thickness
and fuel droplet mean residence time
(where
stands for
or
depending on whether the flame thickness or flame brush thickness is considered).
stands for the averaged velocity of the fuel droplets within the flame
or within the flame brush
. The statistics are taken for all the spray combustion cases at
. The L stands for laminar and in this case
indicates the unstretched stoichiometric premixed flame thickness.
Table 4. Flame thickness , flame brush thickness
and water droplet mean residence time
(where
stands for
or
depending on whether the flame thickness or flame brush thickness is considered).
stands for the averaged velocity of the water droplets within the flame
or within the flame brush
. The statistics are taken for all the spray combustion cases at
. The L stands for laminar and in this case
indicates the unstretched stoichiometric premixed flame thickness.
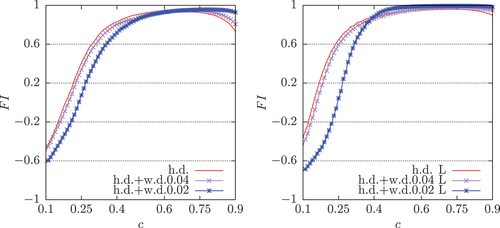
Figure 15. Flame index FI distribution conditioned on progress variable for all the turbulent (left side) and laminar (right side) spray combustion cases, at
.