Figures & data
Figure 1. (a) binding energies and (b) molecular configurations of N*, NO*, N2*, and N2O* on the Pt/CeO2, Pd/CeO2, Pt(111), and Pd(111) surfaces. Numbers in (b) are the bond lengths (in Å) of N-O or N-N.
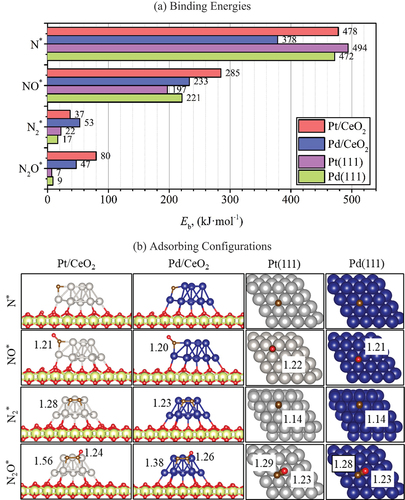
Figure 2. Energy profiles and transition state structures of NO decomposition with metallic sites on supported nanoclusters and flat metal surfaces. Orange numbers in the structure diagrams are the distance between the N and O atoms (). Energies are relative to NO(g) and the clean surface.
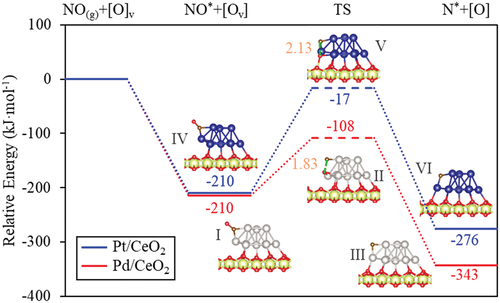
Figure 3. Energy profiles and transition state structures of NO decomposition with metallic sites on supported nanoclusters and flat metal surfaces. Orange numbers in the structure diagrams are the distance between the N and O atoms (). Energies are relative to NO(g) and the clean surface with an oxygen vacancy.
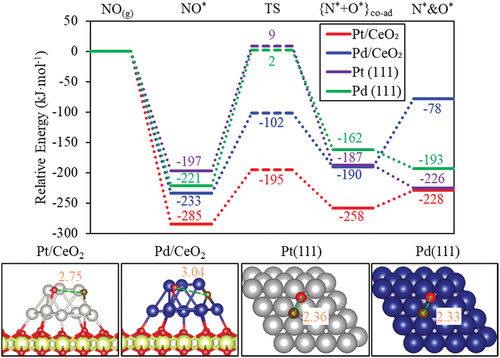
Figure 4. Energy profiles and transition state structures of N-N association on supported nanoclusters and flat metal surfaces. Green numbers in the structure diagrams are the distance between the N and N atoms (). Energies are relative to N2(g) and the clean surface.
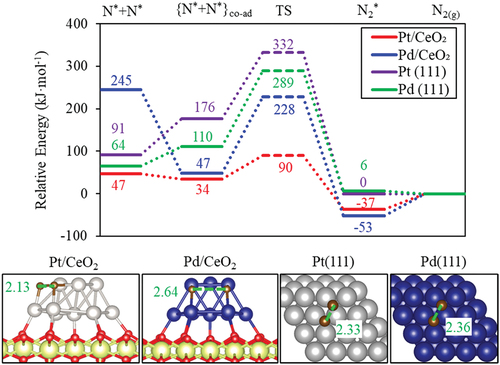
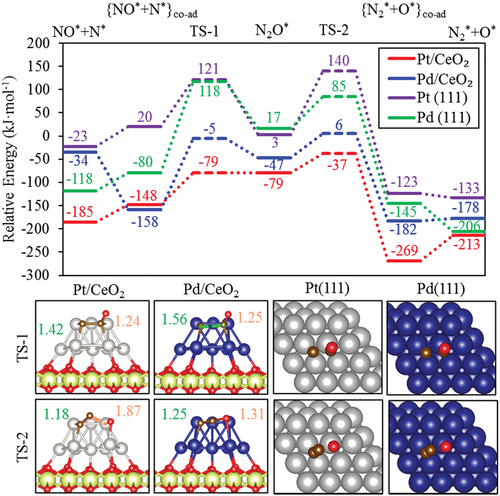
Figure 5. Energy profiles and transition state structures of N2O formation-deoxidation on supported nanoclusters and flat metal surfaces. Green numbers in the structure diagrams are the distance between N and N atoms (), and oranges are between N and O atoms (
). Energies are relative to N2O(g) and the clean surfaces.