Figures & data
Table 1. Simulation details.
Figure 1. Initial domain configurations for (a)–(b) NVT simulations and (c) NVE simulations. CPK coloring is used to distinguish different chemical elements: Fe atoms are in orange; C atoms are in gray; O atoms are in red; H atoms are in white colour.
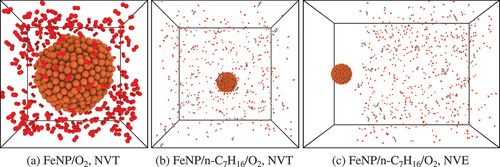
Figure 2. Time evolution of consumed O2 (number of molecules) and Potential Energy (PE) during AlNP and FeNP oxidation without hydrocarbon fuel using QEq and QTPIE charge equilibration methods.
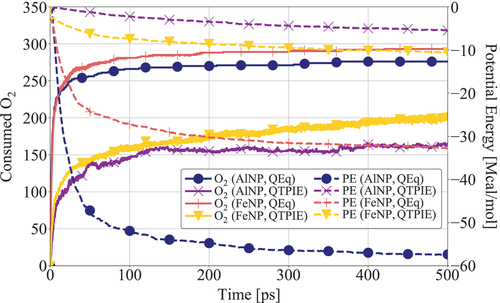
Figure 3. Reactant consumption in the presence and absence of nanoparticles using QEq and QTPIE methods. AlNP and FeNP simulations are conducted at K; gas-only simulations were performed at
K. The number fraction of each molecule corresponds to their number in each timeframe divided by the respective initial number.
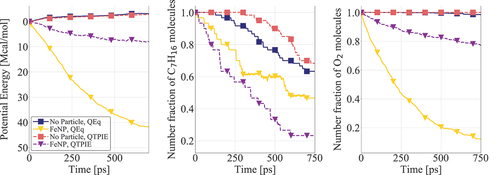
Table 2. Atomic charges of AlNP and FeNP computed with the QEq and QTPIE method at the beginning and end of the simulated time for a nanoparticle-oxygen system without hydrocarbon fuel. Charges are given in multiples of electron charge.
Figure 4. Dissociation reaction of n-heptane molecules at a FeNP surface. The n-C7H16 dissociation is initiated by dehydrogenation. Colours indicate the atomic charges.
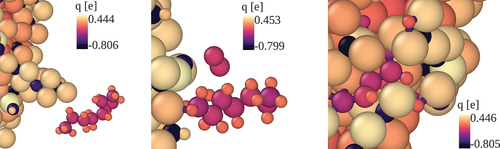
Figure 5. Temperature evolution for various systems comprising FeNP and AlNP.
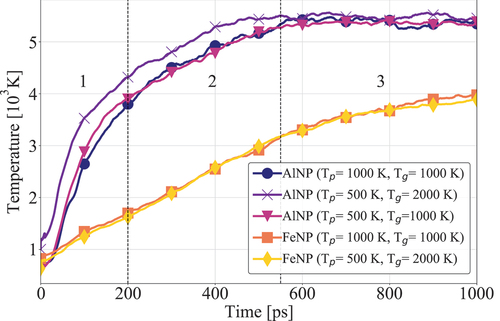
Figure 6. Potential energy and n-heptane/oxygen consumption for systems containing AlNP and FeNP. Results are presented for cases with initial nanoparticle and gas temperatures equal to 1000 K. The number fraction of each molecule corresponds to their number in each timeframe divided by the respective initial number.
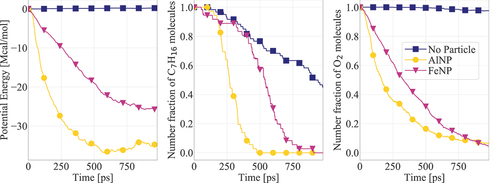
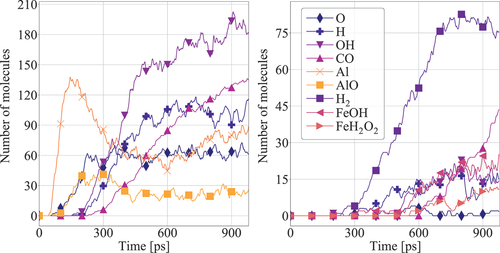
Figure 7. Dominant intermediate species for the systems with AlNP (left) and FeNP (right). Results are presented for cases with initial nanoparticle and gas temperatures equal to 1000 K.