Figures & data
Table 1. Summary of the most typical wildfire suppression strategies (National Wildfire Coordinating Group Citation1996).
Figure 1. Monte Carlo Tree Search algorithm (e.g., see Chaslot et al. Citation2021) adapted for wildfire suppression.
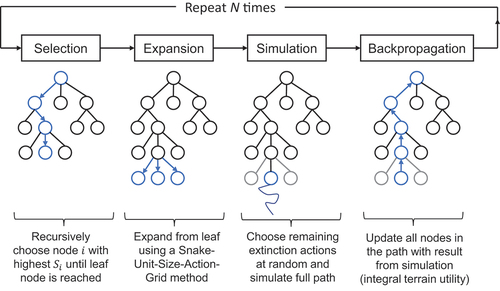
Figure 2. Terrain schematic with the three firebreak extinction actions for the model fire simulation. The action (green) corresponds to the first stage, the
action (yellow) corresponds to the second stage, and the
action (gray) corresponds to the third stage in the underlying Monte Carlo tree (see Supplementary Material, Figure A2). The treasure is displayed in black.
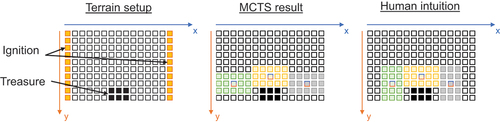
Figure 3. Selected area of investigation for the real fire scenario (left) and terrain schematic with the four firebreak extinction actions obtained from MCTS (right). The action (green) corresponds to the first stage, the
action (yellow) corresponds to the second stage, the
action (gray) corresponds to the third stage, and the
action (dark gray) corresponds to the fourth stage in the underlying Monte Carlo tree (see Figure A3 in the Supplementary Material). The red star on the left map indicates the ignition location of the fire in the real scenario (Mastorakos et al. Citation2023). The fire in the area of interest is modeled as a fire front approaching the domain from west to east.
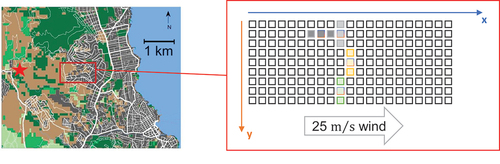
Table 2. Space and time model parameters for the real fire scenario: is the total simulated time,
is the simulation timestep,
and
indicate the grid size in the
and
directions,
and
are the number of cells in the
and
directions, respectively.
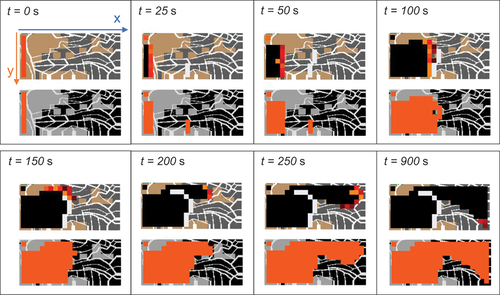
Figure 4. Simulation result at different time instants for the real fire scenario. For each time, the top plot shows the advancement of the fire front (burnt area is indicated by black color); the bottom plot shows the utility map with orange color used to indicate the destroyed cells.