Figures & data
Table 1. Hydrocarbon and alcohol fuels, oxygen, and nitrogen critical properties (Poling, Prausnitz, and O’Connell Citation2001). and
are the critical pressure and temperature.
Figure 1. Numerical stoichiometric IDT at different pressure points (a) the TRF/DIB reduced mechanism against the original TRF/DIB mechanism Andrae and Kovács (Citation2016) (1, 10, 50, 100 atm) for a mixture of toluene, n-heptane, iso-octane, diisobutylene (surrogate D) (Fikri et al. Citation2008), (b) the ethanol reduced mechanism versus the original one (Burke et al. Citation2014; Kéromnès et al. Citation2013; Metcalfe et al. Citation2013) (1, 10, 100 atm).
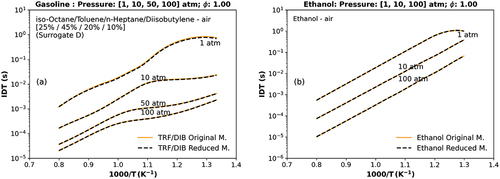
Table 2. Gasoline surrogate (TRF/DIB) and ethanol mechanisms.
Figure 2. Numerical original, reduced and merged (1st and 2nd) IDT of individual components against experimental data: (a) iso-octane (Davidson, Gauthier, and Hanson Citation2005), (b) n-heptane (Gauthier, Davidson, and Hanson Citation2004), and (c) toluene (Davidson, Gauthier, and Hanson Citation2005). The symbol represents experiments from the literature.
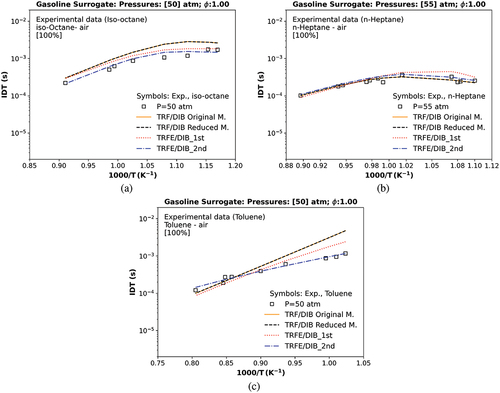
Figure 3. Temperature sensitivity analysis of TRFE/DIB_1st model for single components: (a) iso-octane, (b) n-heptane, and (c) toluene at temperatures equal and lower than 1000 K.
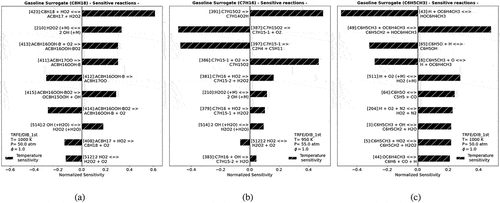
Table 3. Modifying gasoline surrogates (iso-octane, n-heptane, toluene) key reactions constant rate (k).
Table 4. The IDT RMSE for various kinetics models were compared to experimental data of single components of gasoline surrogates (toluene, n-heptane, or iso-octane). The bolded data in each row indicates the model with the lowest values of RMSE compared with the same row experimental data.
Figure 4. Temperature sensitivity analysis of TRFE/DIB_1st model for ethanol at a temperature equal to 1100 K (a). Numerical IDT of ethanol of distinct models against experimental data. The symbol represents experiments (Heufer et al. Citation2011).
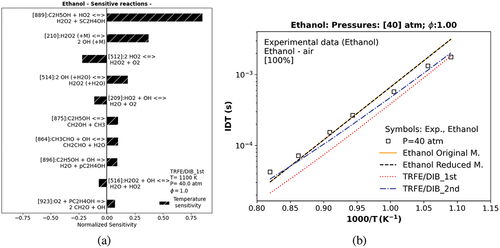
Table 5. Modifying ethanol key reactions constant rate (k).
Table 6. RMSE of IDT for various kinetics models compared to ethanol experimental data. Bold data represents the mechanisms with the lowest RMSE values in each row.
Table 7. Composition of selected experimental gasoline surrogate and ethanol (by liquid vol.%).
Table 8. Predicted critical properties of stoichiometric gasoline surrogate mixtures ( = 1) without and with air concerning the literature mixtures available in .
Table 9. Literature values for n-heptane properties (Poling, Prausnitz, and O’Connell Citation2001) versus Joback’s heptane estimated properties.
Figure 5. 2D heptane chemical structure: a model of heptane, the white balls represent hydrogen atoms, and the grey balls represent carbon atoms.
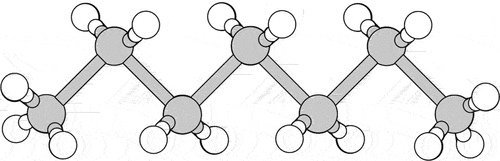
Figure 6. IDT simulations compared with (a) a transcritical data at 20 atm and a supercritical ST data at 75 atm (Heufer and Olivier Citation2010); (b) a transcritical data at 13, and 40 atm (Heufer et al. Citation2011) of a stoichiometric mixture of ethanol, , and
; symbols represent experiments by Heufer and Olivier (Citation2010); Heufer et al. (Citation2011); solid and dashed lines are the TRFE/DIB_2nd mechanism, respectively, using the ideal (IES) and the real cubic gas R-K and the p-R EoS.
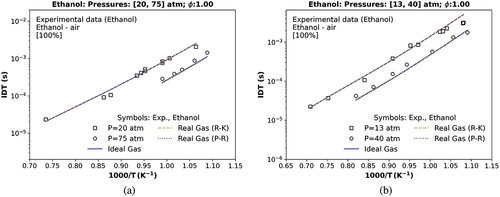
Table 10. IDT RMSE of the TRFE/DIB_2nd model against quinary, quaternary, and ternary mixtures of gasoline surrogates and ethanol experimental data. In addition, the relative deviations (%) of IDT simulations were analyzed between the same kinetics model that used distinct equations of states (redlich-kwong and peng-robinson), compared to the IDT simulations that relied on the ideal equation of state.
Figure 7. IDT simulations compared with (a) a transcritical data at 25 atm and a transcritical data at 55 atm testing a TRF, , and
stoichiometric mixture (Gauthier, Davidson, and Hanson Citation2004); (b) a transcritical data at 10 and 30 atm using TRF/ethanol (Cancino et al. Citation2009). Symbols represent experiments by Cancino et al. (Citation2009); Gauthier, Davidson, and Hanson (Citation2004); solid and dashed lines are the TRFE/DIB_2nd mechanism, respectively, using the ideal (IES) and the real cubic gas RK and the p-R EoS.
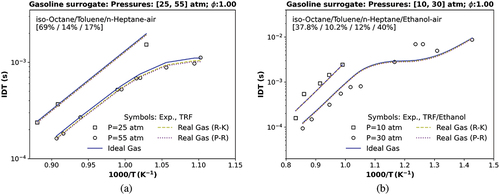
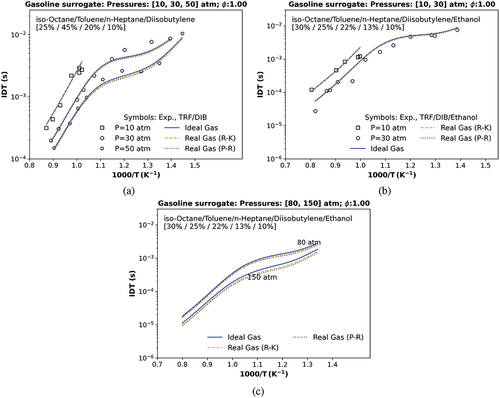
Figure 8. IDT simulations compared with (a) a transcritical ST data at 10, 30, and 50 atm utilizing a stoichiometric mixture of TRF/DIB, , and
(Fikri et al. Citation2008); (b) a transcritical data at 10 and 30 atm with a stoichiometric mixture of TRF/DIB and ethanol (Cancino et al. Citation2011); c) a numerical transcritical IDT condition at 80 and a numerical supercritical IDT condition at 150 atm. Symbols represent experiments by (Cancino et al. Citation2011; Fikri et al. Citation2008); solid and dashed lines are the TRFE/DIB_2nd mechanism, respectively, using the ideal (IES), the real cubic gas R-K and the p-R EoS.