
Figures & data
Table 1 Influences of year, water-stress environment, and N rate on grain yield (kg ha−1), grain protein (g kg−1), and yield loss due to nitrogen stress (YLNS) and water stress (YLWS)
Table 2 Influence of year, water-stress environment, and N rate on protein (g kg−1) and selected dough quality parameters
Figure 1. Relationship between N additions (N fertilizer + mineralized N) and protein content over 2 years.
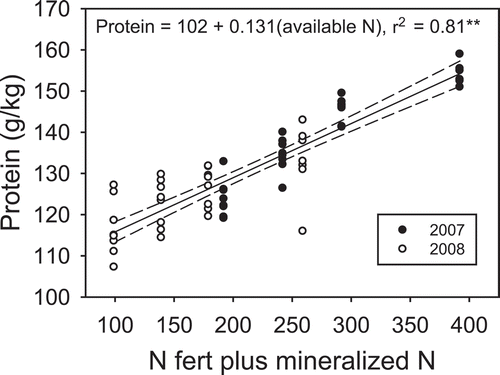
Figure 2. Relationship between protein and dough stability (A) and a comparison between predicted stability, based on protein content and water stress, and measured dough stability (B).
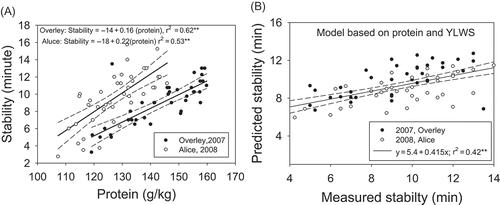
Figure 3. Relationships between yield loss due to nitrogen stress and percentage of glutenin (A), gliadin/glutenin ratio (B), and HMW-GS/LMW-GS ratio (C) in 2007 and 2008.
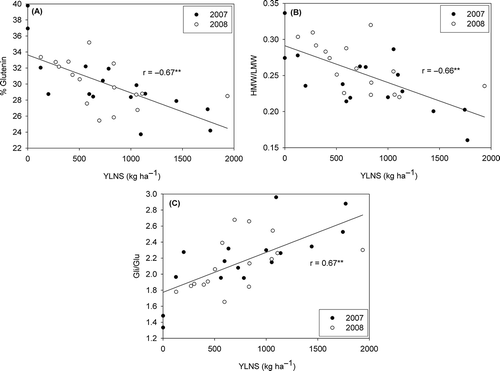
Table 3 Influences of water-stress environment and N rate on protein characterization in 2007 and 2008
Figure 4. Relationships between protein fraction [percentage of glutenin (A), gliadin/glutenin ratio (B), and HMW-GS/LMW-GS ratio (C)] and stability in 2007 and 2008.
![Figure 4. Relationships between protein fraction [percentage of glutenin (A), gliadin/glutenin ratio (B), and HMW-GS/LMW-GS ratio (C)] and stability in 2007 and 2008.](/cms/asset/75e9b0bf-90b2-4f7f-980c-78c15ee12c13/lcss_a_909833_f0004_b.gif)