Figures & data
Figure 1. Distribution of soil samples by state across the continental U.S. within the training dataset for field capacity, permanent wilting point, and available water capacity pedotransfer functions. Soil samples from NAPESHM study sites within the U.S. were used as the validation dataset to test models.
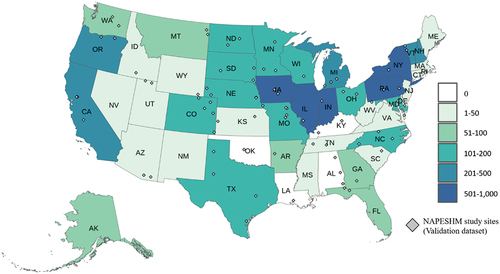
Figure 2. (a-c) measured vs. predicted field capacity water content (θFC) for full random forest (RF), reduced RF, and multiple linear regression (MLR) models on the training dataset. (a-b) full and reduced RF models show out of bag predictions. Validation metrics within plots include percent variance explained, out of bag (OOB) root mean square error (RMSE), and OOB normalized RMSE (NRMSE). (d-f) measured vs. predicted field capacity for full RF, reduced RF, and MLR models for the NAPESHM validation dataset. Text within plots includes the regression equation, adjusted R2, mean absolute error (MAE), RMSE, and NRMSE.
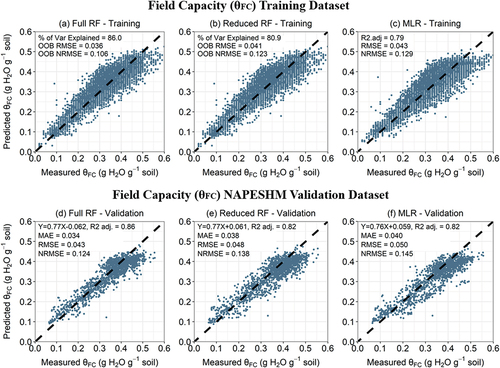
Figure 3. (a-d) partial dependence plots for individual field capacity water content (θFC) predictor variables: sand, silt, clay, and soil organic matter. (e) Multi-predictor partial dependence plot with the interaction between sand and soil organic matter. These partial dependence plots show the influence of individual predictor variables on θFC within the full RF model while all other predictor variables are held constant.
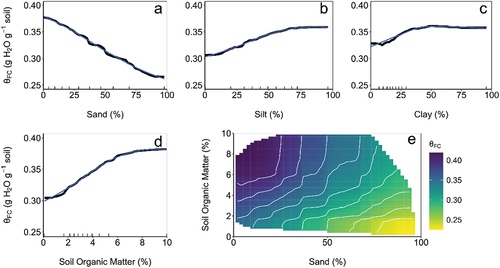
Figure 4. (a-c) measured vs. predicted permanent wilting point water content (θPWP) for full random forest (RF), reduced RF, and multiple linear regression (MLR) models on the training dataset. (a-b) full and reduced RF models show RF model out of bag predictions. Validation metrics within plots include percent variance explained, out of bag (OOB) root mean square error (RMSE), and OOB normalized RMSE (NRMSE). (d-f) measured vs. predicted permanent wilting point for full RF, reduced RF, and MLR models for the NAPESHM validation dataset. Text within plots includes the regression equation, adjusted R2, mean absolute error (MAE), RMSE, and NRMSE.
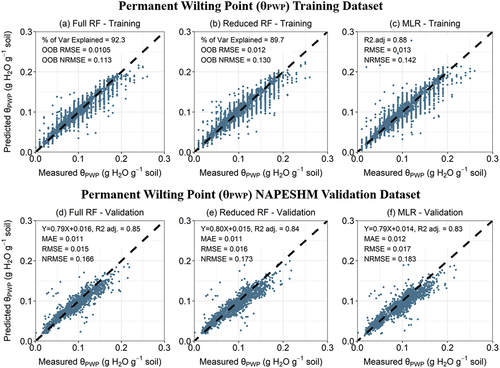
Figure 5. (a-d) partial dependence plots for individual permanent wilting point water content (θPWP) predictor variables: clay, sand, magnesium, and soil organic matter. (e) Multi-predictor partial dependence plot with the interaction between clay and soil organic matter. These partial dependence plots show the influence of individual predictor variables on θPWP within the full RF model while all other predictor variables are held constant.
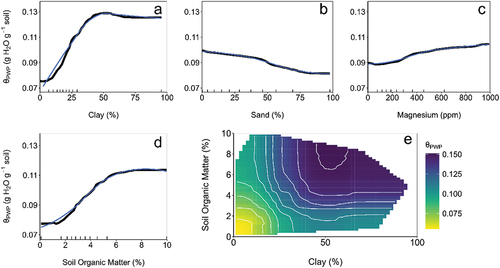
Figure 6. (a-c) measured vs. predicted available water capacity (AWC) for full random forest (RF), reduced random forest, and multiple linear regression models on the training dataset. (a-b) full and reduced random forest models show OOB RF model predictions on the training dataset. Validation metrics within plots include percent variance explained, out of bag (OOB) root mean square error (RMSE), and OOB normalized RMSE (NRMSE). (d-f) measured vs. predicted available water capacity for full random forest, reduced random forest, and multiple linear regression models for the NAPESHM validation dataset. Text within plots includes the regression equation, adjusted R2, mean absolute error (MAE), RMSE, and NRMSE.
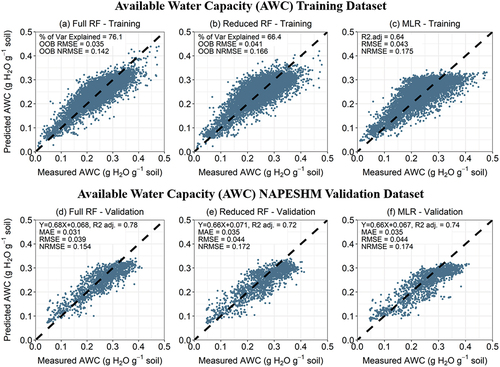
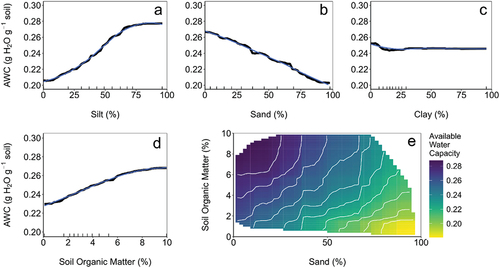
Figure 7. (a-d) partial dependence plots for individual available water capacity (AWC) predictor variables: sand, silt, clay, and soil organic matter. (e) Multi-predictor partial dependence plot with the interaction between sand and soil organic matter. These partial dependence plots show the influence of individual predictor variables on AWC within the full RF model while all other predictor variables are held constant.