
Figures & data
Table 1. Summary statistics for the interest variables.
Figure 1. 30 years of evolution for GDP per capita in CEE countries.
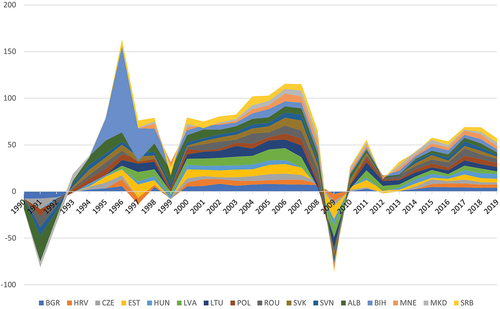
Table 2. Pearson correlation between numeric variables.
Table 3. The testing for stationarity of the numeric variables.
Table A1. Summary description of variables
The estimation of the regression parameters for testing H1 and H2