
Figures & data
Figure 1. Co-occurrence keyword network (1998–2021).
Source: Developed by authors with VOSviewerNote: (a) Co-keyword network visualization (occurrences); (b) co-keyword overlay visualization (occurrences and average publication year scores)
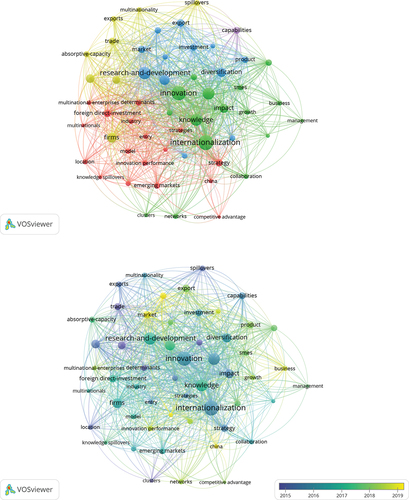
Table 1. Descriptive statistical analysis.
Table 2. KMO and Bartlett’s test.
Table 3. Reliability statistics.
Table 4. Rotated component matrix for Romanian companies.
Table 5. Rotated component matrix for MNCs affiliates.
Summary of statistical models.