Figures & data
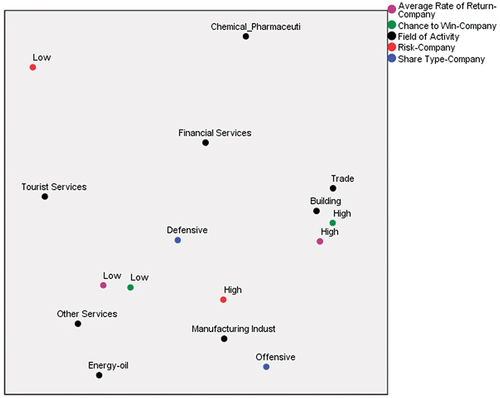
Figure 1. Evolution of the BET index in the period January 2020-December 2021.
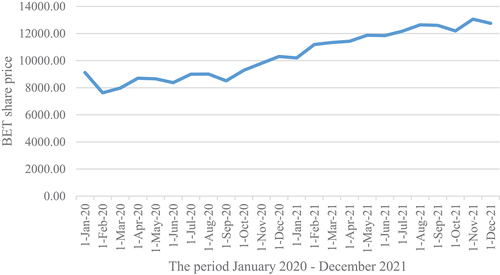
Table 1. Separation by levels of factors influencing organizational resilience.
Table 2. Authors, period analyzed, models and results for variables of interest.
Figure 2. Distribution of the sample analysed by field of activity.
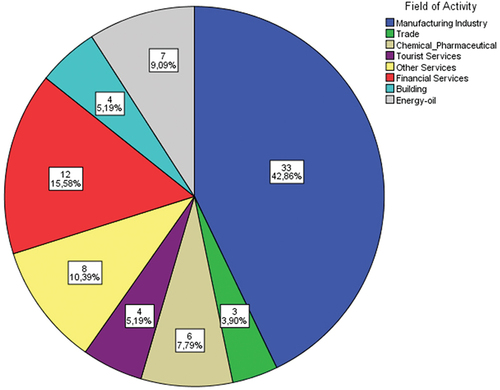
Table 3. List of identified variables and their description.
Table 4. Indicators of descriptive statistics on the BET index.
Table 5. The mean, median and standard deviation of shares for the sampled entities.
Table 6. Regression model parameter estimates.
Table 7. Assessment of the resilience of BSE-listed companies compared to the BET index.
Figure 3. Association of RRes, RRec, RTrans and activity field by BET.
Figure 4. Association of ARR_COMP, CW_COMP, FA, R_COMP and ST_COMP.