Figures & data
Figure 1. Box plots with outliers for all variables, grouped by gender identity.
Note. This figure shows several gender-related differences for the variables of interest. Girls in the sample had higher levels of mathematics anxiety and teacher-pleasing behaviors than boys. Boys in the sample had higher levels for bold problem solving, enjoyment of competition, and contentiousness than girls. Students who self-identified as “non-binary,” “bigender,” and “questioning” showed higher levels of mathematics anxiety and lower levels of teacher pleasing, bold problem solving, interpersonal competitiveness, enjoyment of competition, and contentiousness than both boys and girls in the sample. Several students were considered outliers (open circles) and extreme outliers (stars).
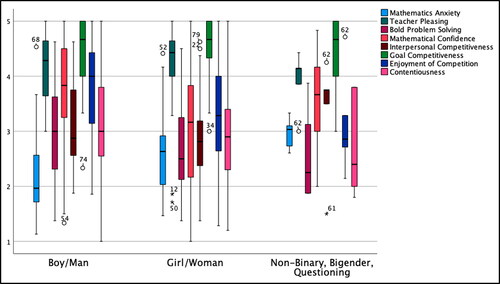
Table 1. Mathematics anxiety predicted by sex assigned at birth.
Table 2. Mathematics anxiety predicted by gender identity.
Table 3. Mathematics anxiety predicted by gender expression.
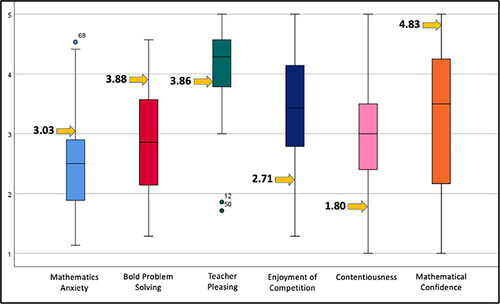
Figure 2. Emmaline’s quantitative results, in yellow, compared to box plots for full sample.
Note. Emmaline’s results, shown with yellow arrows, more closely mirror the results of girls/women, with higher levels of mathematics anxiety and teacher-pleasing behaviors, and lower levels of enjoyment of competition and contentiousness. Students 12 and 50 were outliers with low teacher-pleasing levels. Both are female students who identify as girls.
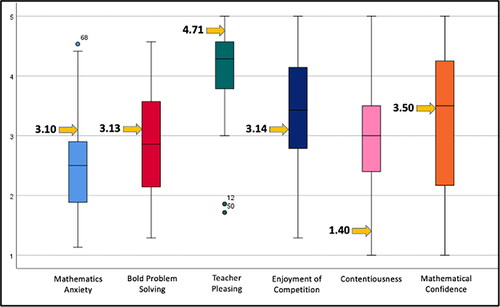
Figure 3. Cameron’s quantitative results, in yellow, compared to box plots for full sample.
Note. Cameron’s results, shown with yellow arrows, show a mix of “masculine” and “feminine” characteristics. While they show lower values for contentiousness and enjoyment of competition and higher values for mathematics anxiety, like girls/women, they show higher values for mathematical confidence and bold problem solving, like boys/men. Students 12 and 50 were outliers with low teacher-pleasing levels. Both are female students who identify as girls.