Figures & data
Figure 1. General methodology for temperature option pricing.
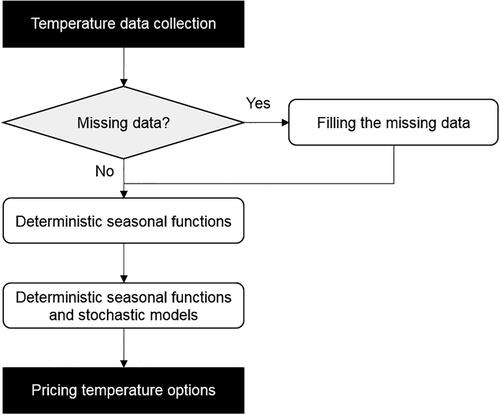
Figure 2. Monthly mean temperature at Bogotá, Colombia (1961–2018). Data source: American National Oceanic and Atmospheric Administration (NOAA, Citation2018).
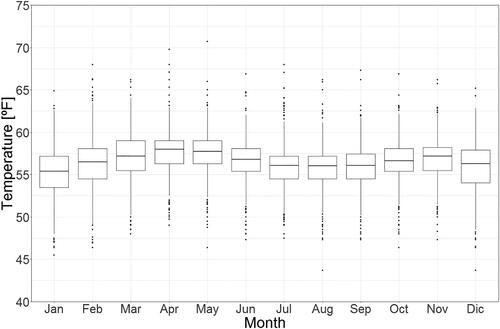
Figure 3. Yearly mean temperature at Bogotá, Colombia (1961–2018). Data source: American National Oceanic and Atmospheric Administration (NOAA, Citation2018).
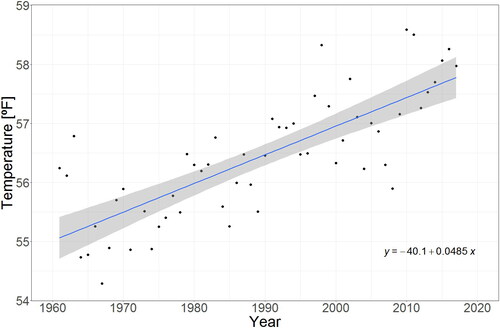
Table 1. Regression results for the temperature models with independent errors ( where
are i.i.d. normal random variables with mean zero and variance
).
Table 2. Regression results for the temperature models with mean reversion.
Table 3. Regression results for the temperature models with the mean reversion and jump process.
Table 4. RMSE of the temperature simulation using five deterministic seasonality functions and two stochastic processes.
Table 5 HDD option pricing on temperature using Model 5 and mean reversion with a strike price (K) of 5 F in Bogotá, Colombia.
Table 6. CDD option pricing on temperature using Model 5 and mean reversion with a strike price (K) of 5 F in Bogotá, Colombia.
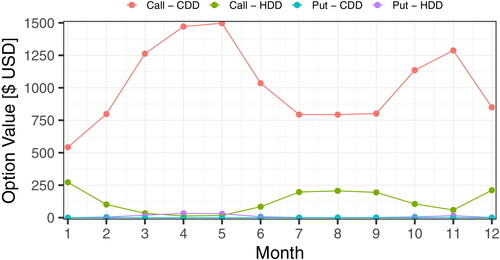
Figure 4. HDD and CDD option pricing with strike price (K) of 5 F for Bogotá, Colombia (θ = 0).