7,188
Views
10
CrossRef citations to date
0
Altmetric
Articles

Visual map and instruction-based bicycle navigation: a comparison of effects on behaviour

, , , , &
Pages 1283-1296 | Received 02 Sep 2016, Accepted 10 Jan 2017, Published online: 31 Jan 2017

Figures & data

Figure 1. Devices included in the study. (a) Paper map setup and (b) example of the route that had to be followed. (c) Moving Map (visual), (d) route guidance information as displayed. (e) Dedicated lights (Hammerhead™) indicating a right turn. (f) indicating an upcoming right turn (picture taken from https://hammerhead.helpshift.com/a/hammerhead-one/?s=light-patterns&f=what-does-each-light-pattern-mean where all patterns are shown).
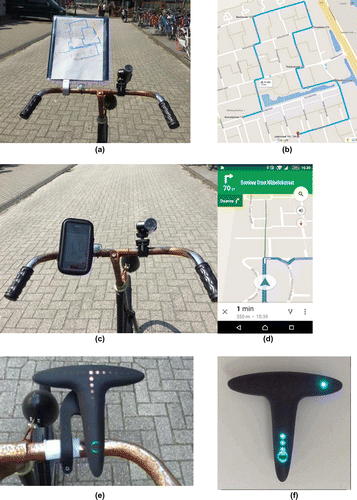
Figure 1. Devices included in the study. (a) Paper map setup and (b) example of the route that had to be followed. (c) Moving Map (visual), (d) route guidance information as displayed. (e) Dedicated lights (Hammerhead™) indicating a right turn. (f) indicating an upcoming right turn (picture taken from https://hammerhead.helpshift.com/a/hammerhead-one/?s=light-patterns&f=what-does-each-light-pattern-mean where all patterns are shown).

Table 1. Moving Map, Dedicated lights and paper map compared with a point system (0-40) on Visual Human Factors Guidelines (based on the General Guidelines for Visual Displays, Green et al. Citation1994).

Table 2. The four conditions and type of information provided.

Table 3. Per condition and age group the average (Ave) number of mistakes and stops to look at device or map and the number of times the test leader had to intervene. SD is indicated in brackets.

Figure 2. Average Speed per condition in km/h on the 160 m selected track. Error bars reflect Standard Error.
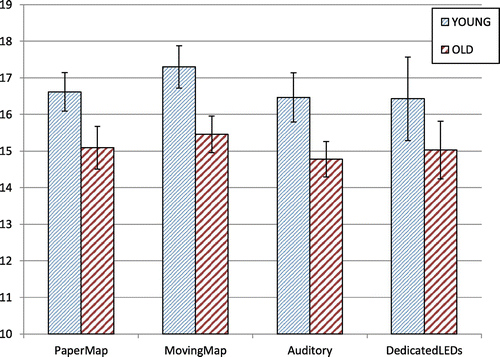
Notes: N = 23 . PaperMap = Paper Map, MovingMap = Moving Map (Visual info displayed on a smartphone), Auditory = only the Auditory route information, and DedicatedLEDs = Dedicated lights device.
Figure 2. Average Speed per condition in km/h on the 160 m selected track. Error bars reflect Standard Error.

Figure 3. Mean number of fixations at the device on the selected 160 m track. Error bars reflect SE.
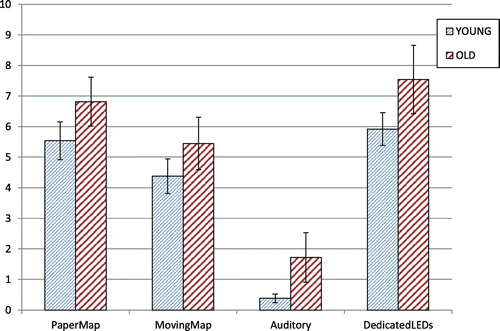
Notes: PaperMap = Paper Map, MovingMap = Moving Map (Visual info displayed on a smartphone), Auditory = only the Auditory route information, and DedicatedLEDs = Dedicated lights device.
Figure 3. Mean number of fixations at the device on the selected 160 m track. Error bars reflect SE.

Figure 4. Average duration of fixations in seconds per condition (Error bars reflect SE).
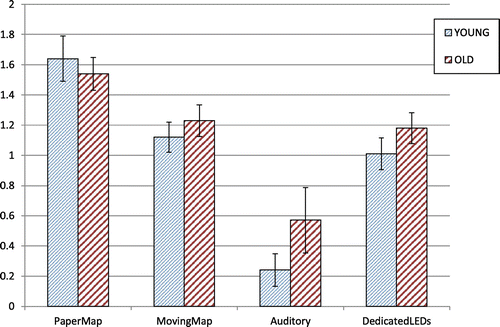
Notes: PaperMap = Paper Map, MovingMap = Moving Map (Visual info displayed on a smartphone), Auditory = only the Auditory route information, and DedicatedLEDs = Dedicated lights device.
Figure 4. Average duration of fixations in seconds per condition (Error bars reflect SE).

Figure 5. Percentage of time looking at the device or map.
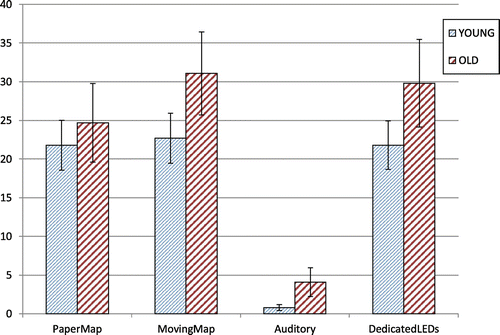
Notes: Error bars reflect SE. PaperMap = Paper Map, MovingMap = Moving Map (Visual info displayed on a smartphone), Auditory = only the Auditory route information, and DedicatedLEDs = Dedicated lights device.
Figure 5. Percentage of time looking at the device or map.

Figure 6. Average ratings on the Rating Scale Mental Effort.
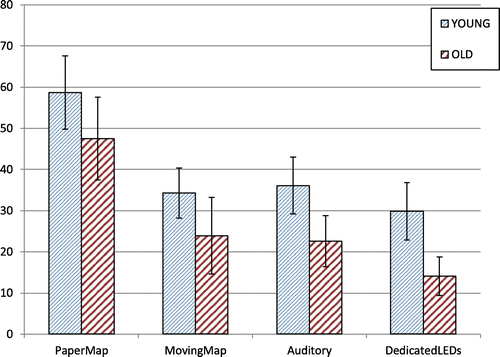
Notes: Error bars reflect SE. PaperMap = Paper Map, MovingMap = Moving Map (Visual info displayed on a smartphone), Auditory = only the Auditory route information, and Dedicated LEDs = Dedicated lights device.
Figure 6. Average ratings on the Rating Scale Mental Effort.

Table 4. User experience questionnaire (Schrepp, Hinderks, and Thomaschewski Citation2014) results and preferred device.

Table 5. Correlation between score on the paper folding test and two performance measures; number of mistakes and speed, in each of the conditions.