
Figures & data
Table 1. Deployment protocol, job assignments and response times.
Figure 1. Schematic of data acquisition instrumentation location with the fire bedrooms (Bedroom 1 & 2) in the right side configuration.
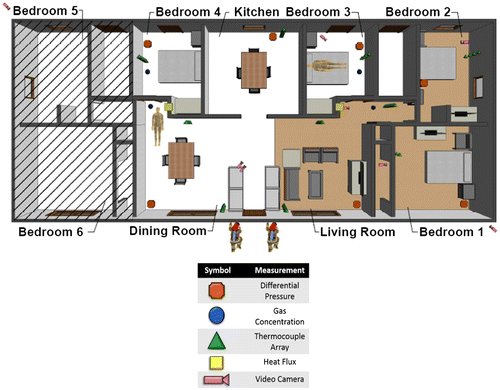
Figure 2. Building air temperatures at each of the measurement locations of the structure for an example and Interior attack scenario (a,b) and Transitional attack scenario (c,d) at measurement heights of 2.1 m (a,c) and 0.9 m (b,d).
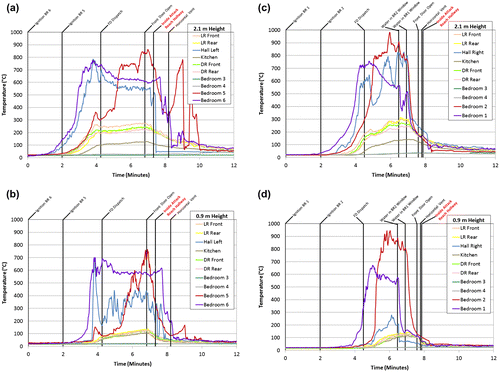
Table 2. Mean (SD) of the maximum air temperatures and hallway heat flux (averaged over the 6 scenarios for each tactic) reached prior to firefighter intervention (water in window or front door open) at three heights at various locations.
Table 3. Mean (SD) of the air temperatures and hallway heat flux measured at the instant when the Inside Attack firefighters had reached the hallway at each of these three heights at different locations (averaged over the 6 scenarios for each tactic).
Figure 3. Heat flux measurements from the hallway immediately adjacent to the fire rooms with open doorways for an example (a) Interior attack and (b) Transitional attack scenario. LR = Living Room, DR = Dining Room, BR = Bedroom, FD = Fire Department.
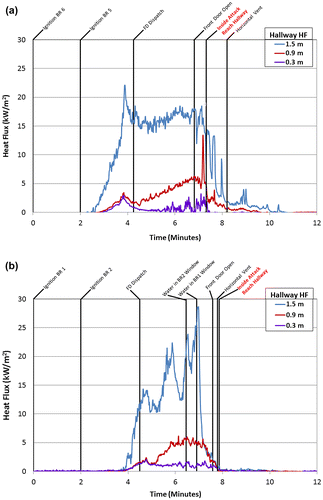
Figure 4. Helmet mounted temperature measurements collected from the nozzleman on the attack team and lead search team member for an example (a) Interior attack and (b) Transitional attack scenario. LR = Living Room, DR = Dining Room, BR = Bedroom, FD = Fire Department.
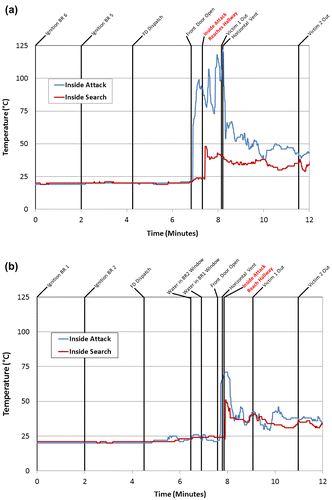
Table 4. Mean (SD) of maximum and average helmet mounted temperature measurements collected from nozzleman on the attack team and lead search team member.
Table 5. Mean (SD) of the maximum skin temperature for firefighters operating in different job assignments and attack tactics.
Table 6. Mean (SD) of the maximum core temperature and core temperature changes for firefighters operating in different job assignments and attack tactics.
Figure 5. Typical core temperature plots from firefighters operating at 4 representative job assignments (Inside, Outside [Pump, Vent], and Overhaul) on the fireground.
![Figure 5. Typical core temperature plots from firefighters operating at 4 representative job assignments (Inside, Outside [Pump, Vent], and Overhaul) on the fireground.](/cms/asset/3ca6b2cf-4103-4429-81f3-c2837b81ed7c/terg_a_1355072_f0005_oc.gif)