Figures & data
Table 1. Anthropometric, gender and maximum aerobic capacity (VO2max) data of the total number of subjects (N = 25) and for the males (N = 13) and females (N = 12) separately with mean (SD).
Figure 1. A subject ascending on the StairMaster after full instrumentation.
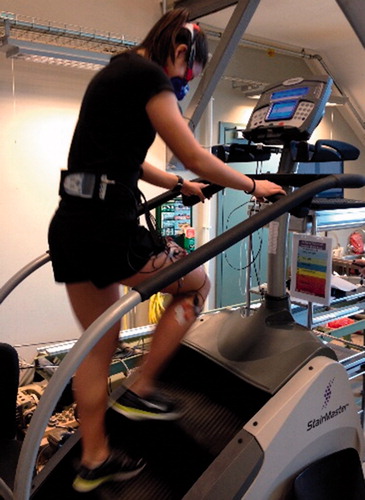
Figure 2. Schematic flowchart and protocol of the stair ascending test.
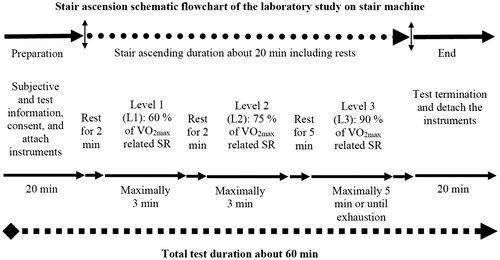
Table 2. Stair ascending capacity comparisons of three individual step rates for all subjects (N = 25) with mean (SD).
Table 3. Stair ascending capacity comparisons between males (N = 13) and females (N = 12) at L3 (90% of VO2max) with mean (SD).
Figure 3. Average oxygen uptakes in normalized periods (0–100%) for all subjects (N = 25) for 3 min each at L1 (a) and L2 (b) and a maximum of 5 min or until exhaustion at L3 (c). The average absolute ascending times were 3.0, 3.0 and 4.3 min at L1, L2 and L3, respectively.
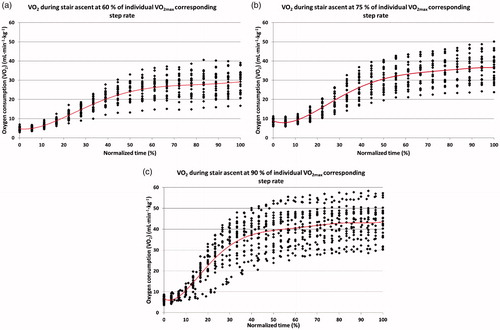
Figure 4. Average changes in EMG MDFs (left column: a, c and e) and normalized AMPs (right column: b, d and f) over the normalized (10–100%) periods at L1, L2 and L3, respectively.
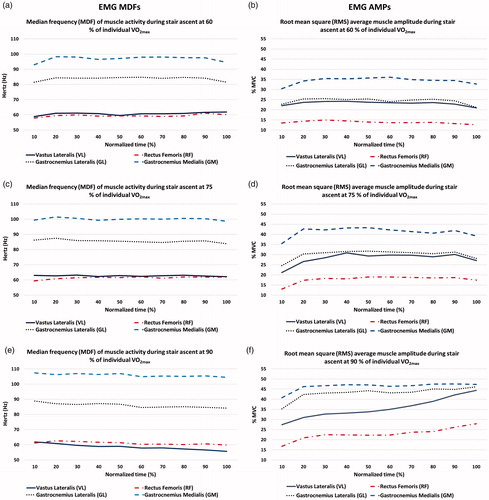
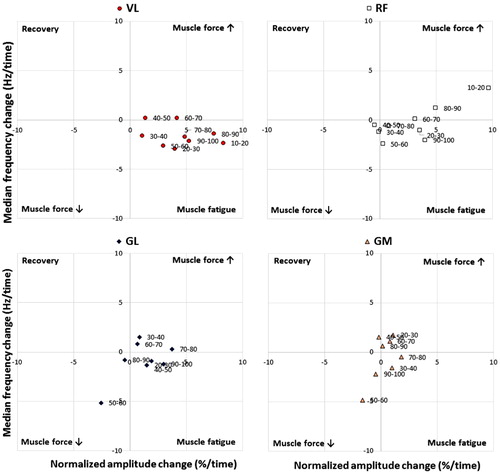
Figure 5. Muscle activity rate changes (MARC) for four muscles in normalized periods (10–100%) periods at 90% VO2max (L3) in the muscle activity interpretation squares (MAIS).