Figures & data
Figure 1. Depiction of the dynamic relationship between agents, their actions, the environment, consequences for the agent and consequences for the agents’ state.
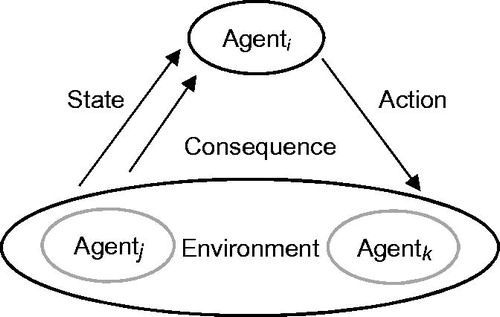
Figure 2. Top-down, angled view of the Netlogo model showing the position of vehicles and vehicle classes represented in the system.
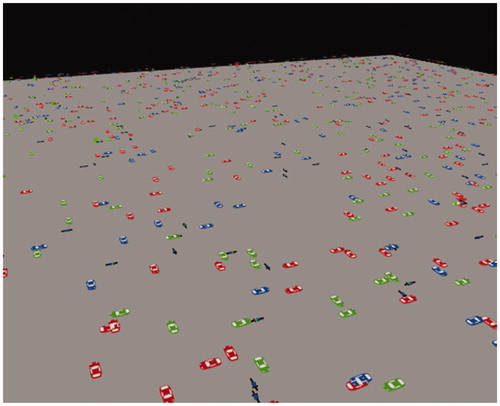
Table 1. Factors, notation, and settings associated with each trial under each experimental condition.
Figure 3. Pseudo-code associated with behaviour of cyclists (Block 1) and cars (Block 2) at intersections as it relates to crash-risk.
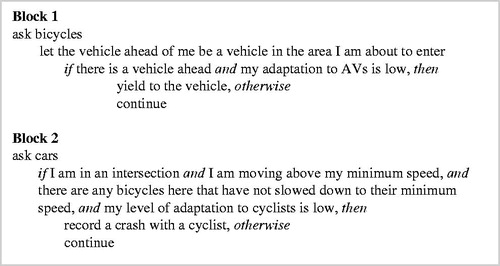
Figure 4. Mean count of car vs cyclist conflicts per time-step with additional deployment of AVs or Manual cars at time-step 100.
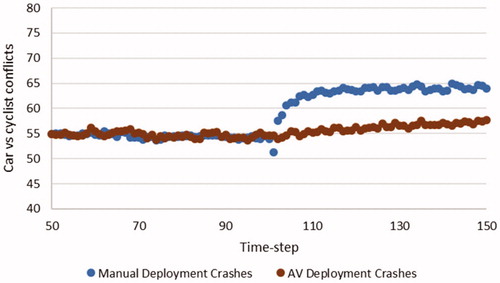
Figure 5. (a) Mean count of car vs cyclist conflicts per time-step with additional deployment of 500 AVs at time-step 100 under each of 3 AV saliency conditions, 0.6, 0.8, and 1.0. (b) Mean association between AVs and the road environment recorded for simulated cyclists per time-step with additional deployment of 500 AVs at time-step 100 under each of 3 AV saliency conditions, 0.6, 0.8, and 1.0.
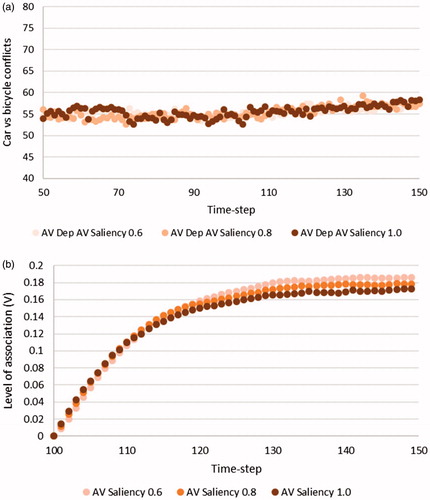
Figure 6. Mean count of car vs cyclist conflicts per time-step with additional deployment of (a) 500 AVs at time-step 100 under each of 3 memory span conditions of 15, 30, and 45 time-steps. (b) 500 manually-driven cars at time-step 100 under each of 3 memory span conditions of 15, 30, and 45 time-steps.
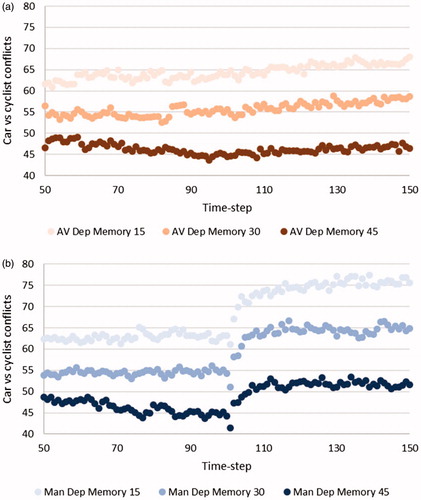
Figure 7. Mean count of car vs cyclist conflicts per time-step with additional deployment of (a) 500 AVs at time-step 100 under each of 3 bicycle saliency conditions, 0.6, 0.8, and 1.0. (b) 500 manually-driven cars at time-step 100 under each of 3 bicycle saliency conditions, 0.6, 0.8, and 1.0.
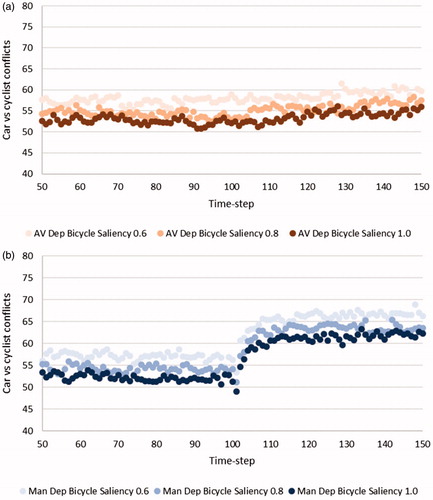
Figure 8. Count of car vs cyclist conflicts per time-step with trade of manually driven cars for AVs at a rate of 1 per time-step over 2000 total time-steps alongside a fitted cubic spline curve and risk of car vs cyclist conflicts per manually driven car.
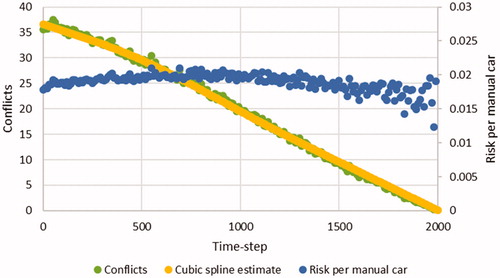
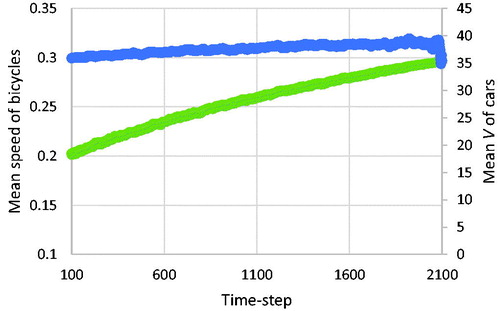
Figure 9. Mean speed of bicycles per time-step and mean association strength (V) of manually driven cars.