
Figures & data
Figure 1. Nurses’ lower extremity MSD risk factor (NLERF) model.
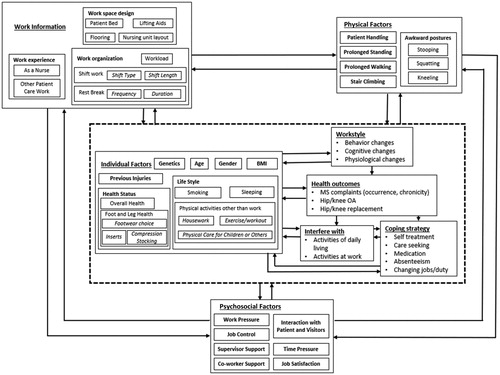
Table 1. Twelve-month prevalence of lower extremity discomfort in study respondents.
Table 2. Descriptive statistics of factors found to be significant in the univariate regression process.
Table 3. Step 1 results: potential risk factors and univariate analyses for hip/thigh discomfort that interferes with normal activities (on the job or off).
Table 4. Step 2 results: multivariate model for factors associated with hip/thigh discomfort that interferes with normal activities (on the job or off).
Table 5. Step 1 results: potential risk factors and univariate analyses for knee discomfort that interferes with normal activities (on the job or off).
Table 6. Step 2 results: multivariate model for factors associated with knee discomfort that interferes with normal activities (on the job or off).
Table 7. Step 1 results: potential risk factors and univariate analyses for foot/ankle discomfort that interferes with normal activities (on the job or off).
Table 8. Step 2 results: multivariate model for factors associated with foot/ankle discomfort that interferes with normal activities (on the job or off).