
Figures & data
Table 1. Basic information of the cooling vests, categorised according to the cooling concept used.
Figure 1. Graphic presentation of the parameters determined in the cooling capacity measurements. Pmax: maximal cooling power; Tc: cooling duration when P ≥ 20 W·m−2; AUC: area under the curve, indicating cooling capacity.
Cooling power in units of Watts per square metre over an 8-h period. The graph demonstrates a decrease in cooling power from a maximum value of 65 W·m−2 to the cooling efficiency threshold of 20 W·m−2 within 3.5 h, which is defined as the cooling duration. The cooling capacity is represented by the area under the cooling power curve over cooling duration period (the time during which the cooling power is above 20 W·m−2).
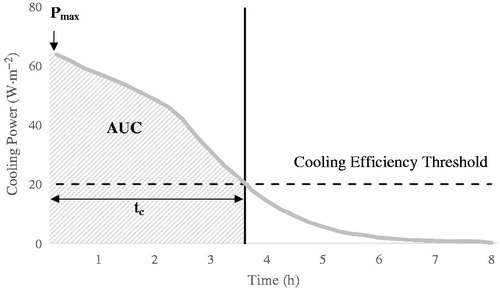
Figure 2. Cooling power of vests within each category over 8-h trial.
Four graphs plotting cooling power of all tested vests over an 8-h period. Each graph presents vests within the same category according to their cooling concept (active vests, evaporative vests, vests with PCM and gel inserts and hybrid vests).
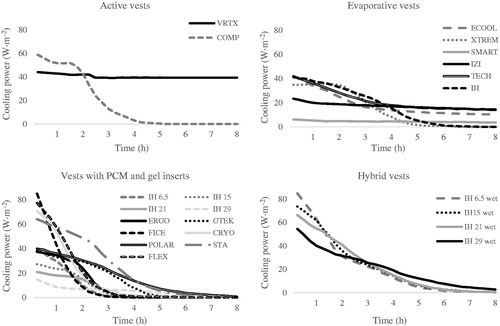
Table 2. Cooling capacity of the tested cooling vests.
Table 3. Thermal resistance of the tested cooling vests.
Table 4. Relative evaporative resistance (Re; %) of the activated cooling vests.