
Figures & data
Figure 1. Boxplots of Total PAH levels (µg/m2) collected from neck skin under different hood designs stratified by doffing method. The box represents the interquartile range (IQR), the horizontal line in each box represents the median, the upper whisker represents the upper fence 1.5 IQR above the 75th percentile, the lower whisker represents the lower fence 1.5 IQR below the 25th percentile, and the dots represent potential outliers.
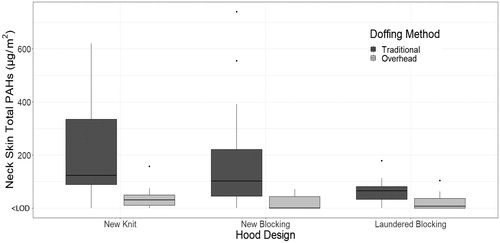
Table 1. Total PAH levels (µg/m2) and non-detectable samples (%) collected from neck skin under different hood designs stratified by doffing method.
Table 2. Comparison of inner/outer shell PAH levels (ng/100 cm2 sample) in samples collected from one new knit hood and three new particulate-blocking worn for the same fire trial.
Table 3. Physiological responses for simulated firefighting trial in different hood designs and PPE laundering conditions.
Table 4. Firefighters reported perceptions of hoods before firefighting (Pre) and after activity (Post).