Figures & data
Table 1. Glove samples used for donning.
Figure 1. Experimental set-up for donning procedure. Donning area, where the hands are in view of the camera, is shown in grey. The participant was standing in the donning area with hands in front of the table.
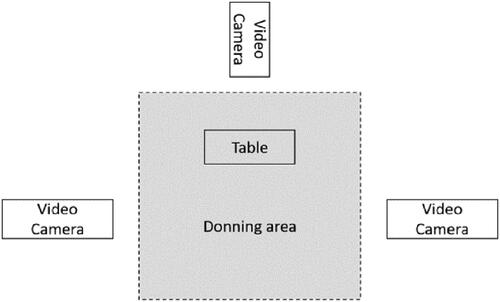
Figure 2. Moist sense device used for measuring skin moisture.
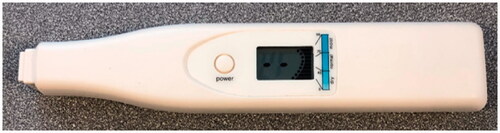
Figure 3. Diagram of hands where moisture measurements were taken.
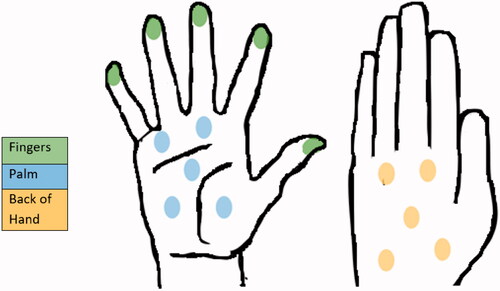
Figure 4. Stress-strain curve of each in-house formed glove. Error bars indicate standard deviation.
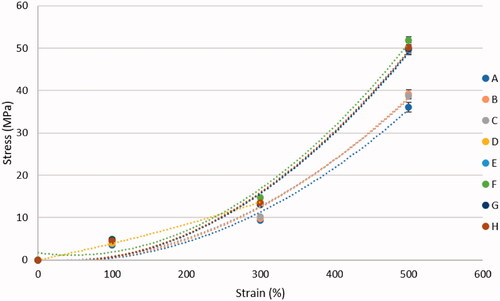
Table 2. Results of physical testing of the glove materials.
Figure 5. Average skin moisture on the hands in dry and wet conditions. Error bars indicate standard deviation.
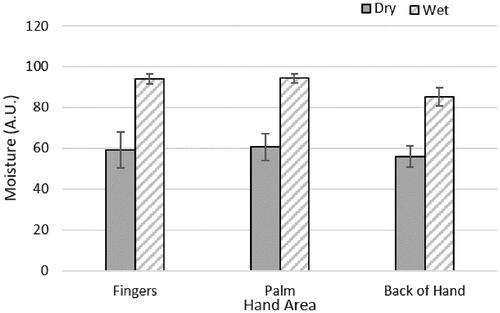
Figure 6. Average time taken for each of the three donning stages to be completed for one glove. Error bars indicate standard error.
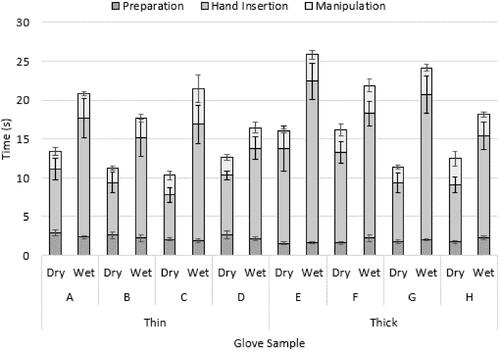
Table 3. Total average time taken to don one glove with pick up time removed.
Table 4. One-way ANOVA on the donning time of a single glove in each condition.
Table 5. Tukey’s (HSD) on the thick gloves in the wet condition.
Table 6. p-Values of Kruskal–Wallis test on thin and thick gloves in dry and wet conditions from the hand insertion stage of donning.
Table 7. p-Values of post-hoc Dunn’s test on thick gloves in the wet condition from the hand insertion stage of donning.
Table 8. T-test results comparing thin and thick gloves in dry and wet conditions.
Table 9. p-Values obtained from paired t-tests between gloves in dry and wet conditions at each stage of the donning process.
Figure 7. Correlation of stiffness at 100% strain with the preparation stage of the donning process in the dry condition.
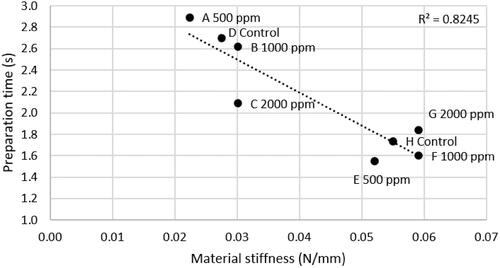
Table 10. Correlation of stiffness at 100% strain with total donning time and each of the three stages of the donning process.
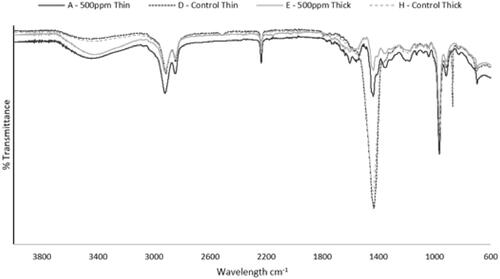
Figure 8. FTIR spectra of developed films showing control samples (D and H) have not undertaken the chlorination process.