
Figures & data
Table 1. Guiding questions for the expert interviews.
Figure 1. First potential antecedents for trust in AI within production management.
Organisational chart of the six antecedents divided into the three characteristic groups, first the AI group consisting of the two antecedents perceived capability and perceived understandability, second the human group consisting of the expert status and the digital affinity, and third the decision situation group consisting of the predictability and the error costs.
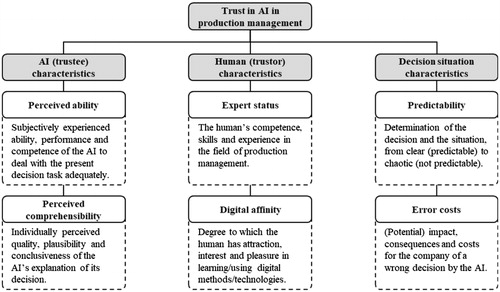
Figure 2. Model of hypotheses under investigation.
Illustration of the six antecedents and trust in the SOR model, as described above. In addition, there is an arrow going from each antecedent to the trust, with the label of the respective hypothesis. Here, the arrows for hypotheses H5 and H6 are drawn in dashed lines to indicate the assumed mediated effect.
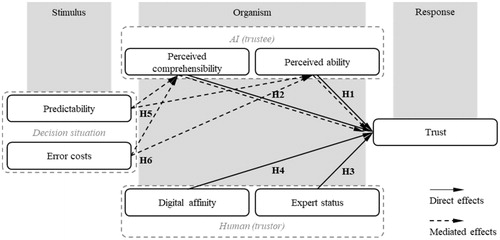
Table 2. Measurements to operationalise the variables.
Table 3. Evaluation of measurement model.
Table 4. Evaluation of Fornell-Larcker criterion.
Table 5. Evaluation of cross-loadings.
Table 6. Evaluation of heterotrait-monotrait ratio (HTMT).
Table 7. Evaluation of structural model with trust as independent variable.
Figure 3. Coefficients of the structural model.
Illustration of the six antecedents and trust with an arrow going from each antecedent to trust labelled with the respective effect size and significance. Significant effects on trust with their respective effect size are digital affinity (0.117), perceived ability (0.480), perceived comprehensibility (0.174), predictability as indirect effect (−0.137), and error costs also as indirect effect (0.085).
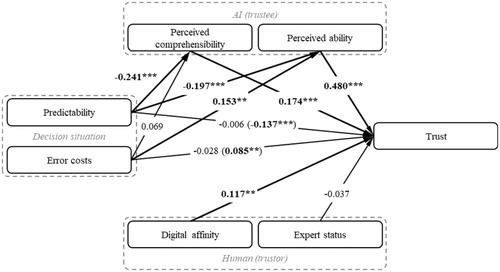
Table 8. Results of hypothesis testing.