
Figures & data

Figure 1. Accuracy and precision’s relationship in body scanning measurements.
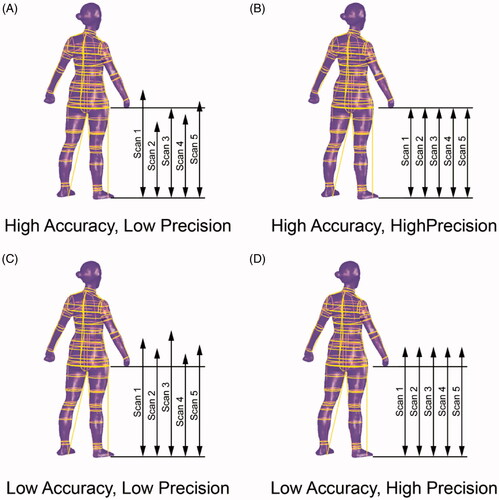
Figure 2. Study tree. Assets from Muammark (Citation2017).
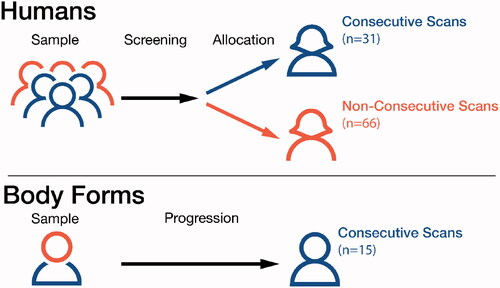
Figure 3. Illustration of the outlier removal process. Solid circles represent the five data points in the set. The solid blue line represents the median of the set. Dashed red box illustrates the symmetric window with the red data points included in the reduced set and the black points excluded.
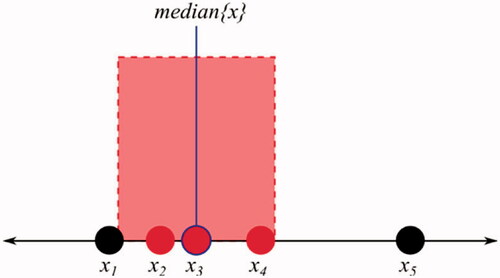
Figure 4. Percentage of all measurements suitable for garment development; Precision = 3σ.
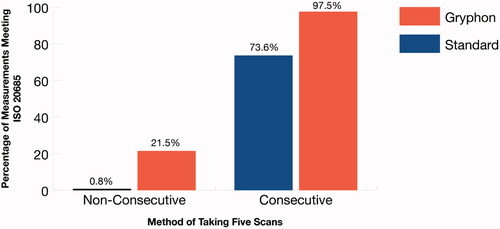
Figure 5. Gryphon + five Consecutive Scans against ANSUR I and II’s Allowable Errors.
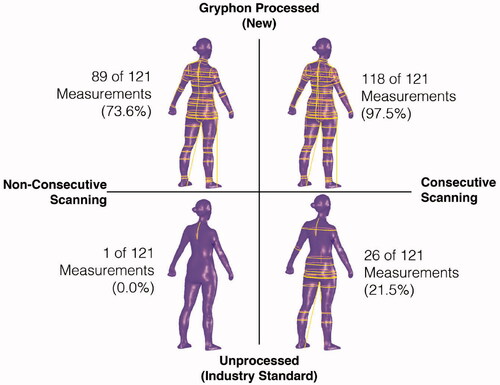
Table 1. MANOVA, consecutive and non-consecutive precision differences categorised by their importance to garment development.
Table 2. MANOVA: Human and Body Form reliability differences categorised by their importance to garment development.
Figure 6. A flow chart of Gryphon scanning process.
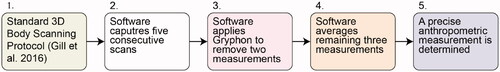
Table A1. Body scanning precision (cm) of all investigated scan methods to 3 standard deviation, representing 99.73% of all attainable measurements.
Table B1. Definition of measurement definitions used in our study (Sizestream Citation2019).