Figures & data
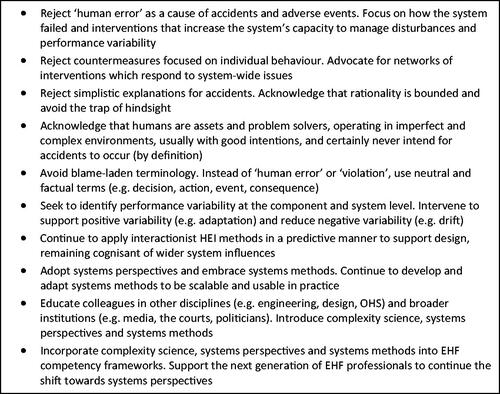
Figure 1. Trends in the use of the term ‘human error’ across journal articles from 1940 to 2020, comparing: Human Factors, Applied Ergonomics, Ergonomics and all records in Scopus (note, Scopus figures refer to secondary y axis due to higher numbers overall).
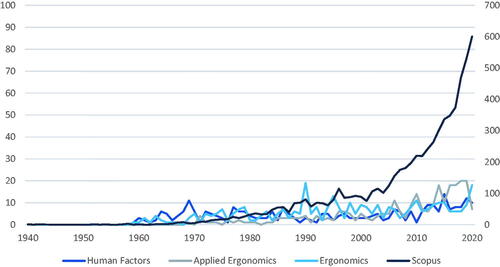
Table 1. Perspectives on safety management and accident causation.
Table 2. Overview of human performance and human error models; in order of publication date.
Table 3. Human error methods and taxonomies.
Table 4. Human error defined in relation to complex systems properties.
Figure 2. Overview of the evolution of models (white boxes), methods (white ovals), and underpinning theory (grey boxes) by perspective. Note, alignment against perspectives is intended to be approximate and fuzzy rather than a strict classification.
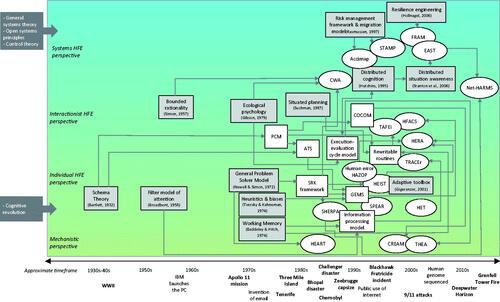
Figure 3. A proposed way forward.