
Figures & data
Table 1. Subject characteristics of male and female participants.
Figure 1. Schematic of the study design.
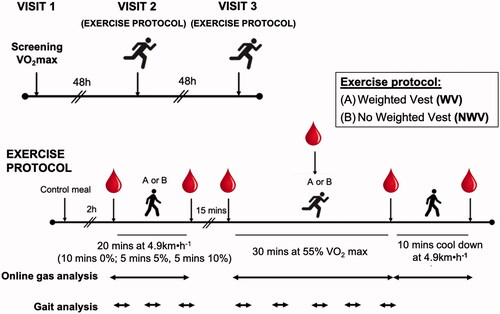
Table 2. Comparison of physiological variables across the walking condition.
Figure 2. Cardiorespiratory responses to weighted vest running. There was an increase in VO2 in the weighted vest condition in males (A, p < 0.001), and females (B, p < 0.01). This was associated with an increase in ventilation in males (C, p < 0.001) and females (D, p < 0.05) and an elevation in heart rate in males (E, p < 0.001) and females (F, p < 0.001). *p < 0.05; **p < 0.01 WV vs. NWV.
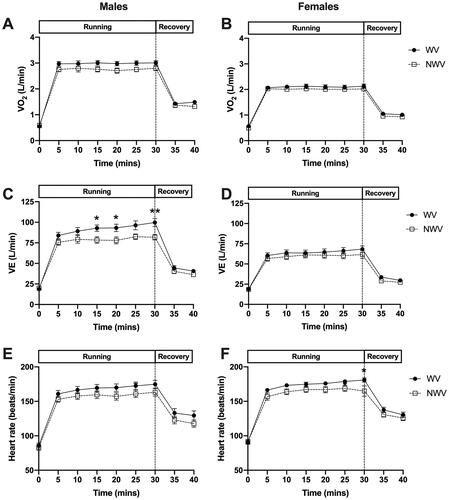
Table 3. Comparison of physiological variables across the 30-minute run.
Figure 3. Energy expenditure and substrate utilisation in males and females during weighted vest running. The addition of a weighted vest promoted a significant increase in RER in males (A, p < 0.001) but not females (B, p > 0.05). This was associated with a shift towards greater CHO oxidation in males (C, p < 0.001) and females (D, p < 0.01) and an increase in energy expenditure in males (E, p < 0.001) and females (F, p < 0.05). *p < 0.05; **p < 0.01; ***p < 0.001 WV vs. NWV.
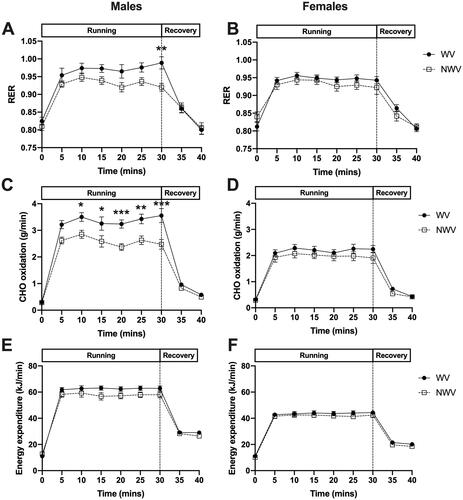
Figure 4. Increased blood lactate levels in the weighted vest condition in males (p < 0.05) but not females (p > 0.05). **p < 0.01 WV vs. NWV.
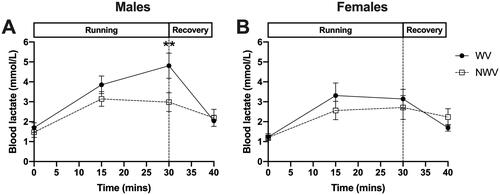
Table 4. Comparison of biomechanical variables across the walking and running conditions.