
Figures & data
Table 1. The experimental design was a 2 × 2 within-subject design.
Figure 1. Schematic illustration of the four conditions. The area under the loading curve is identical in each diagram. High external weight results in a higher spinal load intensity and therefore a shorter task duration as time until the defined area under the loading curve is reached. For conditions High/Small and High/Large the spinal load intensity is higher and therefore the task duration as time until the defined area under the loading curve is reached, is shorter.
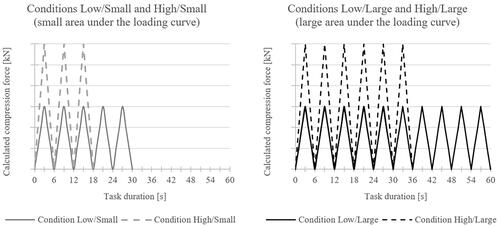
Figure 2. Symmetric lifting/lowering task in the sagittal plane with marked trunk inclination angle. The arms were always held perpendicular to the ground and the external weight was always held in both hands. Participants performed a lifting and lowering movement in the sagittal plane with a weight held in both hands. The trunk inclination was standardised to a range of 0° to 40°.
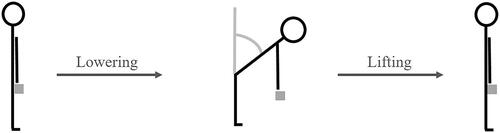
Figure 3. Overview of the measuring times of the different variables. Each task was followed by a resting period. Muscle activity and heart rate were measured continuously and RPE was obtained after completing the lifting/lowering task. As reference value, HRrest was determined before each task after a resting period and in the same, sitting position. Muscle activity and heart rate were measured continuously, RPE was obtained after completing the lifting/lowering task and HRrest was determined before each task after a resting period.
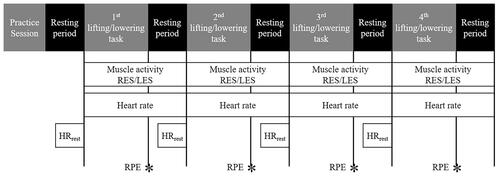
Figure 4. Averaged course of the calculated loading curve for Low/Small and High/Small. The minima and maxima correspond to the movement. For an area of 700 kNs the task duration, as time until an area is reached, doubles. The maximum compression force for high and low external weight was 2805 N and 2466 N, respectively. For the small area, this results in a mean duration of 223 s for Low/Small and 195 s for High/Small.
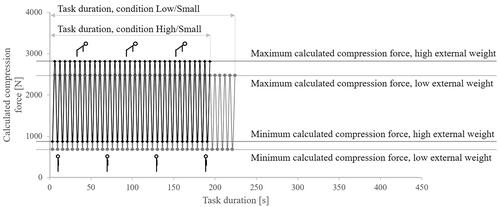
Figure 5. Normalised mean muscle activity (± Standard error) of the resting periods (left) and lifting/lowering tasks (right). The muscle activity is at a similar level during resting period but significantly higher for conditions with high external weight despite the same area during the lifting/lowering tasks.
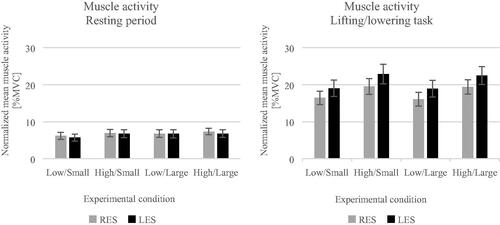
Table 2. Results of Friedman test for normalised mean muscle activity and Wilcoxon test for pairwise comparisons.
Table 3. Mean and Standard error for normalised mean muscle activity.
Figure 6. Mean HR reserve (± Standard error) and rate of HR change (± Standard error). The mean HR reserve and rate of HR change is clearly higher for conditions with high external weight despite the same area during the lifting/lowering tasks.
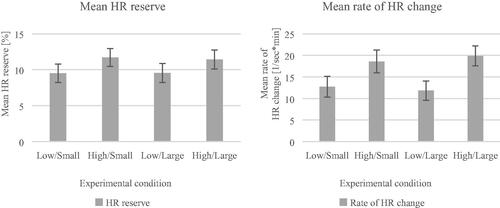
Table 4. Results of two-way repeated measures ANOVA for effects of external weight, area under the loading curve and their interaction.
Table 5. Mean and standard error for HRR and HRC.
Figure 7. Mean RPE (± Standard error). The RPE is significantly higher for conditions with high external weight despite the same area during the lifting/lowering tasks.
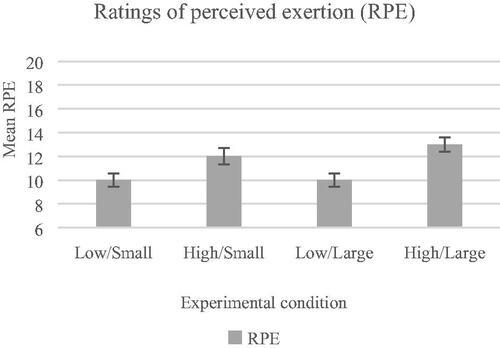
Table 6. Results of Friedman analysis for RPE and Wilcoxon test for pairwise comparisons.
Table 7. Mean and standard error for RPE.
Table 8. Spearman’s correlation coefficients for the factors examined.