Figures & data
Figure 1. PRISMA diagram of literature review and study selection.
A flow chart describing the number of records in each step of the selection process. Caused by exclusion criteria, 358 initial records results in 74 studies for further analysis.
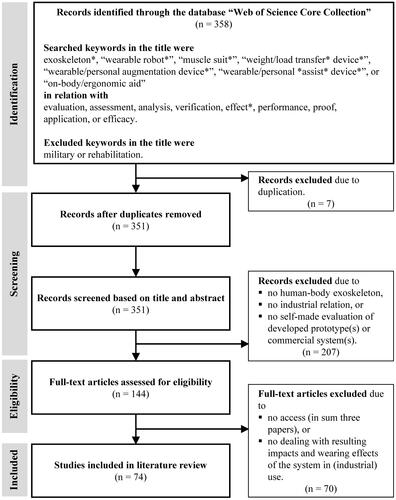
Table 1. Summary of reviewed studies evaluating industrial exoskeletons.
Figure 2. Matrix for illustrating the respective prevalence of different types of analyses for selected research objects (in the style of Pinto-Fernandez et al. [Citation2020]).
A comparison of the described types of analyses with their respective research objectives highlighting the frequencies in the middle, the number of accessible objectives on the right, and the superordinate dimensions on the left.
![Figure 2. Matrix for illustrating the respective prevalence of different types of analyses for selected research objects (in the style of Pinto-Fernandez et al. [Citation2020]).](/cms/asset/94917009-283a-452b-b2db-529e91c7eef8/terg_a_1970823_f0002_b.jpg)
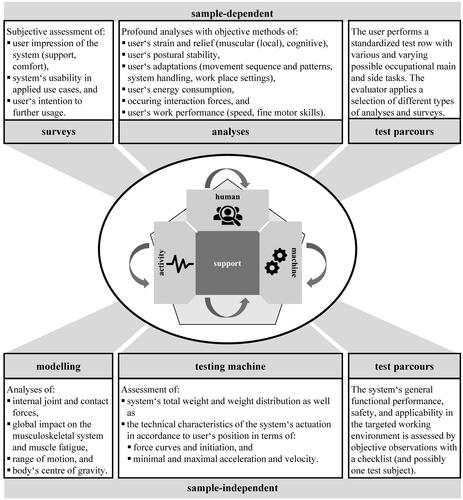
Figure 3. Considerable aspects for a harmonised evaluating methodology of industrial exoskeletons.
A cluster of evaluation opportunities considering the described four principles with the three dimensions of support situations in the centre as well as harmonised test cases and methodologies around divided in the respective sample dependency.