Figures & data
Table 1. Demographic data for all participants across driving experience.
Figure 1. The frame sequence illustrates the progression of a hazardous trial (prior to occlusion) from the point where the bus starts to turn left (bottom image), through the point where the bus emits a flash of the indicator (middle image) and the point immediately prior to occlusion where the bus has already emitted a couple of flashes of the indicator (top image).
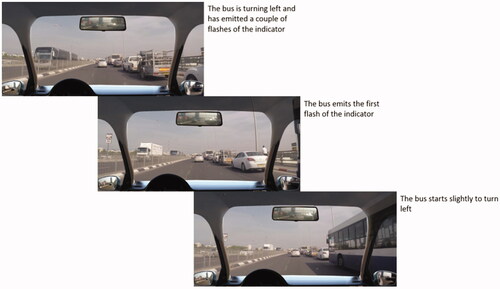
Figure 2. The frame sequence illustrates the progression of a non-hazardous trial (prior to occlusion) from the cyclist in front (bottom image), through the driving car approaching the cyclist (middle image) and the point immediately prior to occlusion where the cyclist simply continues their trajectory.
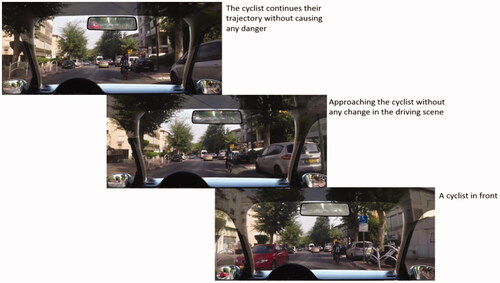
Table 2. A description of the a priori hazardous and non-hazardous traffic situations selected for each clip.
Figure 3. Percentage of prediction accuracy across driving groups with standard error bars representing 95% confidence interval. The dashed line represents the mean chance expectancy.
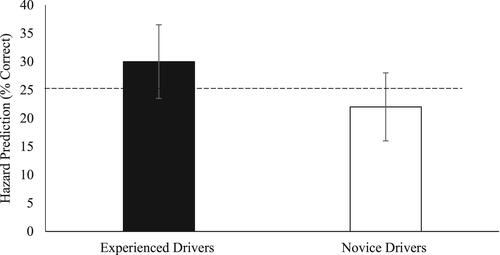
Figure 4. Percentage of correctly identifying that there was a hazard vs. failing to identify the hazardous situation for the hazardous clips across the experienced groups with standard error bars representing 95% confidence interval. The dashed line represents the mean chance expectancy.
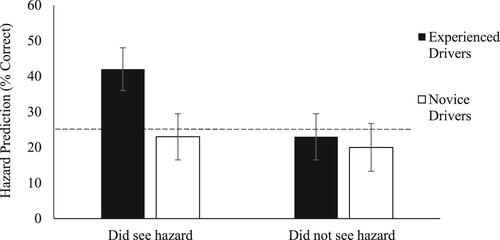
Figure 5. (a) (Top left) one of the parked cars turns on its brake lights and another car emerges from the right side of the street. (b) (Top right) a car on the left starts reversing back into the main road. (c) (Bottom left) a motorbike appears from the right and approaches the main road without stopping at the red lights. (d) (Bottom right) an urban bus from the right intends to join the lane of the camera car.
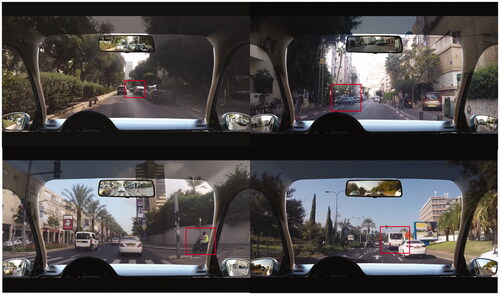
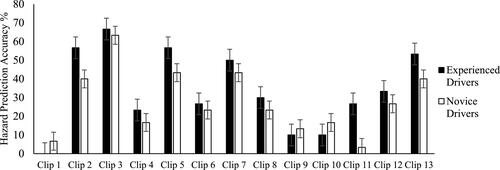
Figure 6. Hazard prediction accuracy scores across all hazardous clips for both experienced and novice drivers (with standard error bars added).