
Figures & data
Figure 1. (A) Conceptual description of the Smart Workwear System vibrotactile feedback module including an IMU, a vibration unit, a smartphone device with the smartphone application. The black arrows indicate the data or feedback signal flow, and the white block arrows illustrate the wireless (Bluetooth) communication flow. (B) Photo of the system vibrotactile feedback module showing an IMU, a vibration unit, and the smartphone application ErgoRiskLogger. (C) Photo of the system on a person.
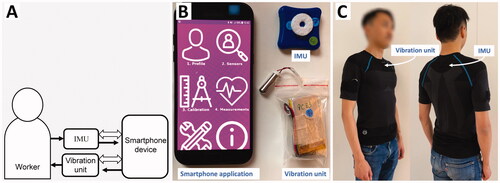
Table 1. The number of participants (n = 15) reporting musculoskeletal complaints and work-disabling musculoskeletal complaints (in parentheses) during the last 12 months at baseline.
Figure 2. Photos displaying a typical work cycle comprising of sorting and scanning of packages arriving in a metal container (A–E), placing and scanning the packages in a destination (cardboard) container (F–G), and pushes the container to a conveyor belt (H–J).
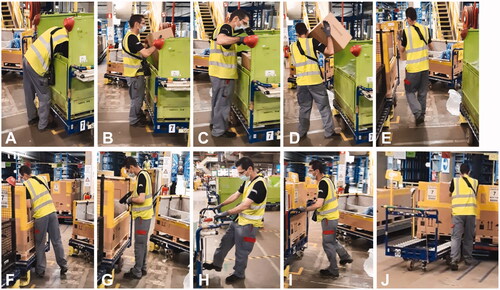
Figure 3. Illustration of the study setting. Five measurement days were performed, including the baseline, feedback training session 1, feedback training session 2 and post-training session (on the same day), and follow-ups 1 and 2. Surveys were collected on all measurement days with specific topics as illustrated in the boxes under each measurement day.
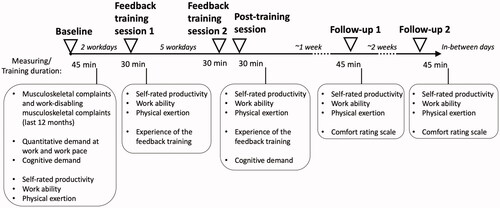
Figure 4. (A) Accumulated proportion of time of trunk forward inclination ≥30°, ≥45°, and ≥60° at baseline, the feedback training sessions 1 and 2, post-training session, and the follow-up sessions 1 and 2. (B) the 90th, 95th and 99th percentile trunk inclination angles, and the 10–90th percentile range for trunk inclination. Statistically significant (p < 0.05, Wilcoxon signed-rank test) differences between the scenarios are displayed with their corresponding p-values.
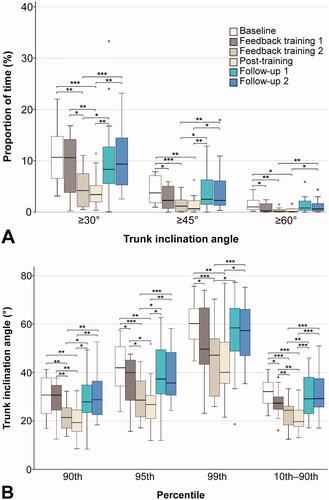
Table 2. Group median values and median intra-individual percentage differences (diff) (compared to the baseline) in the proportion of time in trunk inclination ≥30°, ≥45°, and ≥60°, and the group 90th, 95th, and 99th percentile angles and 10th–90th percentile range of trunk forward inclination in the feedback training sessions 1 and 2, the post-feedback training and the follow-up sessions 1 and 2.
Table 3. Median (IQR) ratings of the 21-point Comfort Rating Scale with verbal anchors at each end: ‘Low’ (0), and ‘High’ (20).