Figures & data
Table 1. The names and visual descriptions of test regions.
Figure 1. Texture, stickiness, pleasantness, discomfort, and the confidence of texture perception scales.
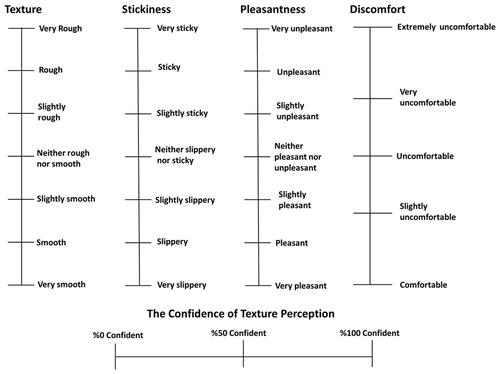
Figure 2. The females (n = 11) and males (n = 9) of superior static skin COF distribution across the 36 tested regions. All measurements were taken from the left-hand side of the body assuming symmetry (Claus et al. Citation1987; Meh and Denišlič Citation1994).
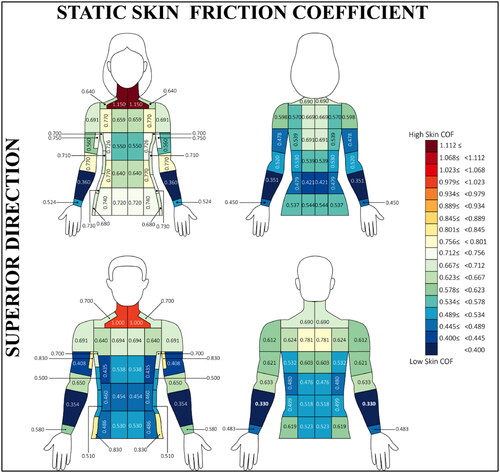
Figure 3. The females (n = 11) and males (n = 9) of inferior static skin COF distribution across the 36-testing location. All measurements were taken from the left-hand side of the body assuming asymmetry (Claus et al. Citation1987; Meh and Denišlič Citation1994).
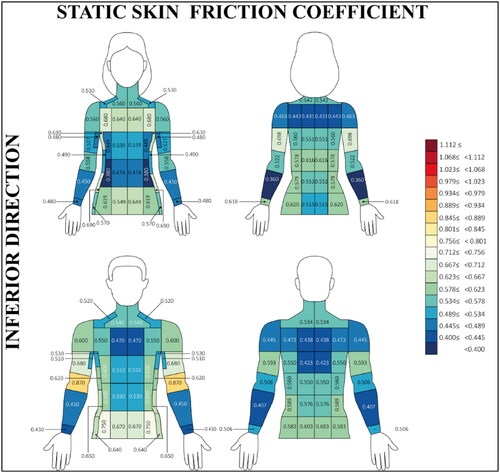
Figure 4. The females (n = 11) and males (n = 9) of texture perception distribution across the 36-testing location. All measurements were taken from the left-hand side of the body assuming asymmetry (Claus et al. Citation1987; Meh and Denišlič Citation1994).
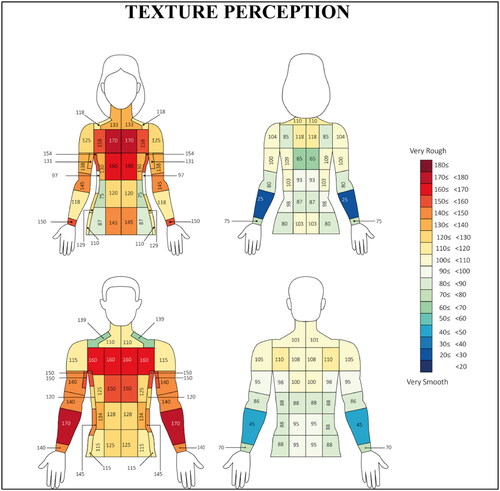
Figure 5. The females (n = 11) and males (n = 9) of stickiness perception distribution across the 36-testing location. All measurements were taken from the left-hand side of the body assuming asymmetry (Claus et al. Citation1987; Meh and Denišlič Citation1994).
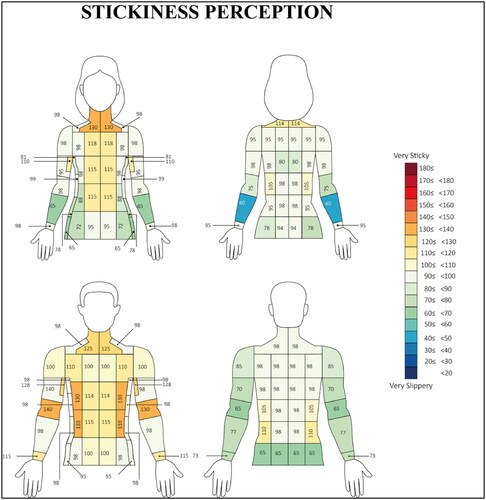
Figure 6. The females (n = 11) and males (n = 9) of pleasantness perception distribution across the 36-testing location. All measurements were taken from the left-hand side of the body assuming asymmetry (Claus et al. Citation1987; Meh and Denišlič Citation1994).
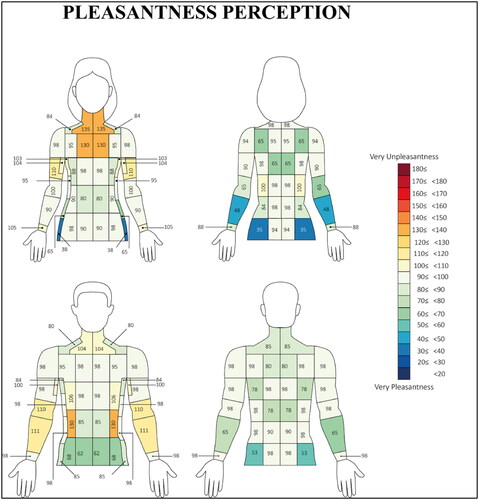
Figure 7. Individual data and box and whiskers with median connection line of the confidence of texture sensation ratings for forearm (above) and male (below).
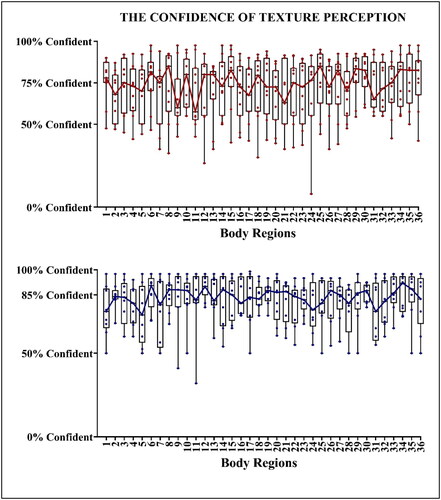
Figure 8. The body mapping of texture sensitivity to dynamic skin friction.
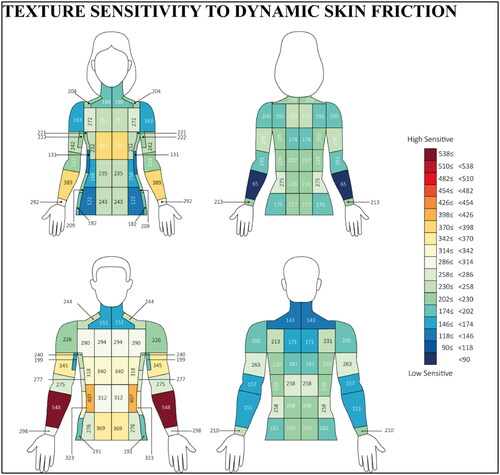
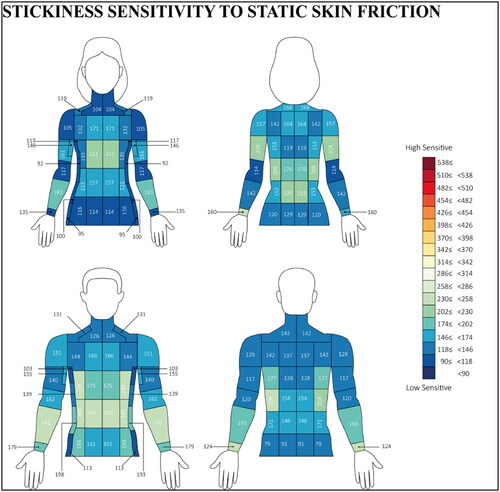
Figure 9. The body mapping of stickiness sensitivity to static skin friction.