
Figures & data
Table 1. Cross tabulation of the FDM event counts (frequencies per 10,000 flights), standardised Pearson residuals, and (percentages) of five FDM categories array on column across the three stages of the pandemic displayed on rows.
Table 2. Cross tabulation on the FDM event counts (frequencies per 10,000 flights), standardised Pearson residuals, and (percentages) of FDM events on seven flight phases array on column across three stages of pandemic displayed on row.
Table 3. Cross tabulation on the FDM event counts (frequencies per 10,000 flights), adjusted standardised residuals, and (percentages) of FDM events on five fleets array on column across three stages of pandemic displayed on rows.
Figure 1. Evolution of the number of flights, FDM events and ASRs between June 2019 and May 2021. The scale on the right-hand side (2000 per scale), displays numbers of flights each month (Red-line); the scale on the left-hand side (100 per scale) shows frequencies of FDM events (Blue-line) and ASRs (Green-line) across 24 months of data.
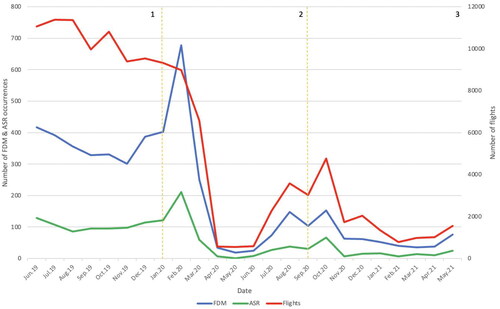
Table 4. Cross tabulation on the frequencies, adjusted standardised residuals, and (percentages) of pilots submitted ASRs on FDM events across three stages of the pandemic.
Figure 2. The significance association between the three stages of the pandemic and the five categories on FDM exceedances for 24 months are illustrated using a bar chart. The values (on the top of each bar) of FDM exceedances on five FDM categories among three stages of pandemic represented the number of events based on chi-square analysis.
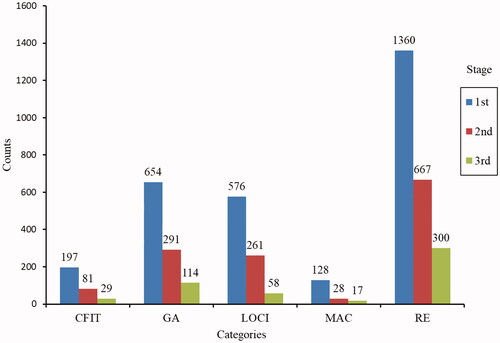
Figure 3. The significance association between the three stages of the pandemic and seven flight phases on FDM exceedances for 24 months shown as bar chart. The values (on the top of each bar) of FDM exceedances on the seven flight phases among three stages of pandemic represent the number of events based on chi-square analysis.
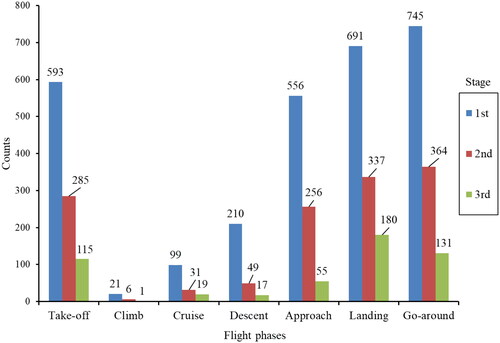
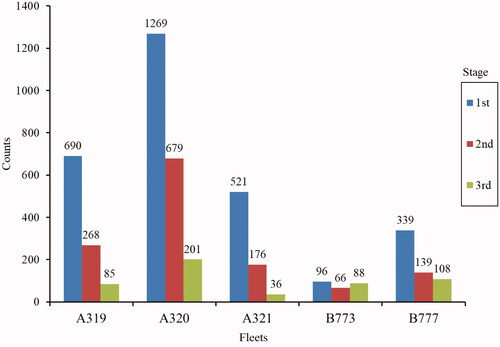
Figure 4. The significance association between the three stages of the pandemic and five fleets on FDM exceedances for 24 months are shown as bar chart. The values (on the top of each bar) of FDM exceedances on the five fleets among three stages of pandemic represented the number of events based on chi-square analysis.
Data availability statement
Due to the privacy restrictions as well as a legally binding confidentiality agreement with the data provider, it is not possible for their data to be shared publicly, so supporting data is not available.
