
Figures & data
Figure 1. Conceptual model of leader airtime management for EMCC teams.
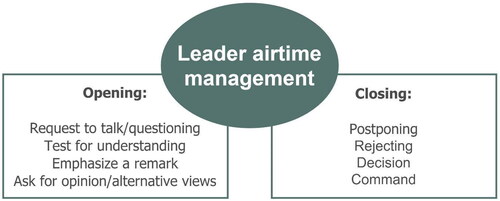
Figure 2. Overview of team meetings and phases of EMCC teams in the Netherlands.
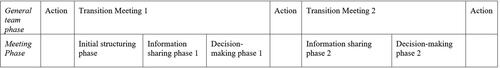
Table 1. Coding scheme leader airtime management.
Figure 3. Graphical overview of leader airtime management in two EMCC team meetings. Note. The selected teams are high (Team 1) and low performing (Team 2) on both components of team effectiveness.
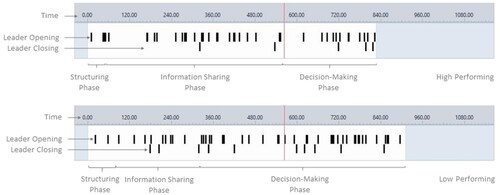
Table 2. Means, standard deviations, and intercorrelations of the study variables.
Figure 4. (a–d) Graphical overview of leader airtime management opening and closing in the different team phases between high and low effective teams. (a,b) Concern the team effectiveness component TSA. (c,d) The team effectiveness component TDM. Phase 1 = Initial structuring phase, phase 2 = information sharing phase meeting 1, phase 3 = decision-making phase meeting 1, phase 4 = information sharing phase meeting 2, phase 5 = decision-making phase meeting 2.
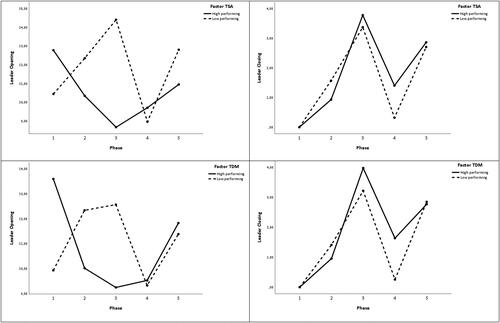
Table 3. Comparisons of leader airtime management across the different team phases.
Table 4. Comparisons of leader airtime management between teams high and low effective in TSA within the different team phases.
Data availability statement
The data that support the findings of this study are available from the corresponding author, MH, upon reasonable request.