Figures & data
Figure 1. Overview of the questionnaires and set up of the field study.
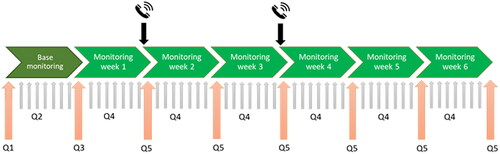
Figure 2. Screen capture of the questionnaire on a mobile phone. Three different screens are shown, with questions and answers in the plasterers native language (Dutch). From left to right we asked whether they performed these tasks and for how long, whether they used the exoskeleton for these tasks and whether their shift duration was shorter or longer.
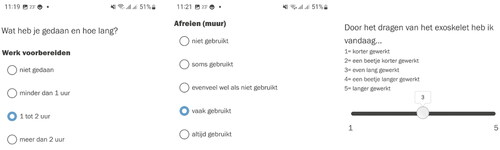
Figure 3. Skelex 360 (Rotterdam, The Netherlands).
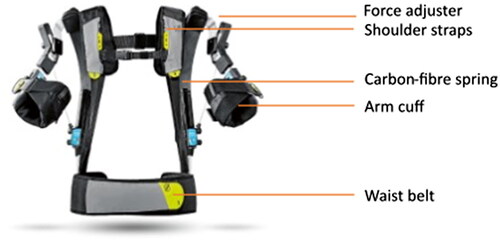
Table 1. An overview of the reported tasks that the plasterers performed over the six weeks.
Figure 4. Exoskeleton use per task. The size of the circle represents the percentage of respondents per day for each ordinal response). Tasks with Beta coefficients representing ‘often used’ and ‘always used’ are marked green, tasks with Beta coefficients indicating ‘as much used as not used’ are marked in yellow, and tasks representing ‘not used’ or ‘sometimes used’ are marked in red. Per colour coded category, the two most executed tasks are visually shown.
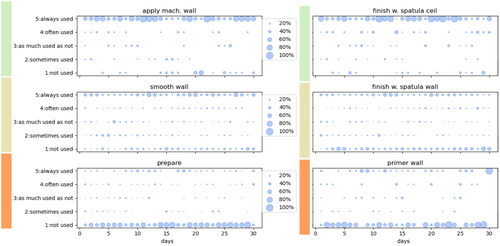
Table 2. Parameter estimates for exo usage per task exponentiated beta coefficients predicting exoskeleton use.
Figure 5. Experienced load per exo use category. Significant differences compared to exo use 1 (not used) are presented with a star. Boxes range from the 25th to the 75th percentile, whiskers represent the data range, and median is indicated with a solid orange line.
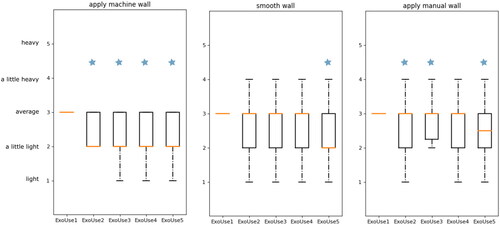
Figure 6. The effect of exo use on breaks and working hours. Percentage of respondents is represented by the size of the dots (see legend for reference).
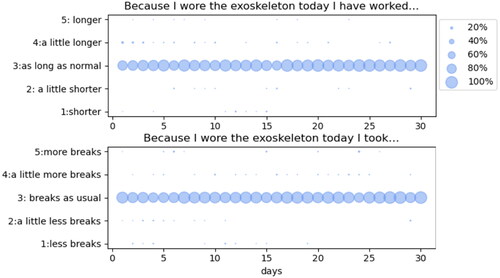
Figure 7. Perceived productivity and quality. Percentage of respondents is represented by the size of the dots (see legend for reference).
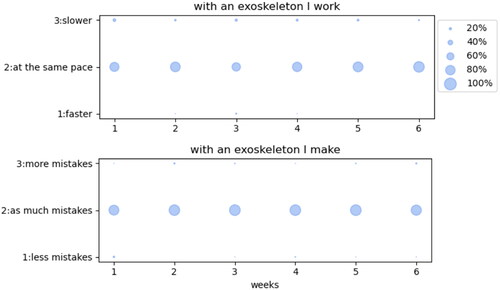
Figure 8. Experienced advantages (pros) and disadvantages (cons) when working with the exoskeleton, as reported on a weekly (w1–w6) basis. The percentages of the number of respondents are shown. Multiple answers were allowed, adding op to totals exceeding 100%.
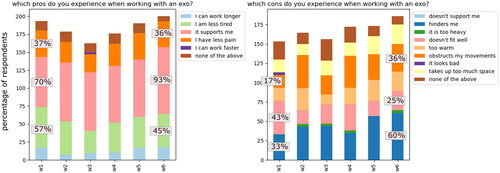
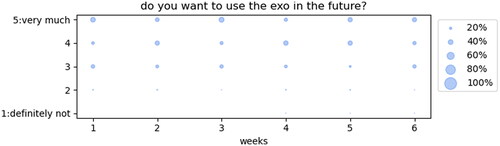
Figure 9. Will to use the exoskeleton. Percentage of respondents is represented by the size of the dots (see legend for reference).