Figures & data
Table 1. Photo experiment 2 × 2 design conditions.
Figure 1. Photos from the experiment showing the two HMI 2 (Full HUD) conditions.
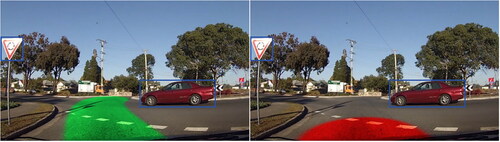
Figure 2. In the top left photo showing the pathway as green, participants were explained: ‘If the car intends to ACCELERATE (maintain speed or go faster), a GREEN pathway will be shown’. In the bottom left photo showing the pathway as yellow, participants were explained: ‘If the car intends to CRUISE (neither accelerate nor brake), a YELLOW pathway will be shown’. In the right-hand photo where the pathway is shown as red. Participants were explained: ‘If the car intends to brake (slow down and/or stop), a red pathway will be shown’.
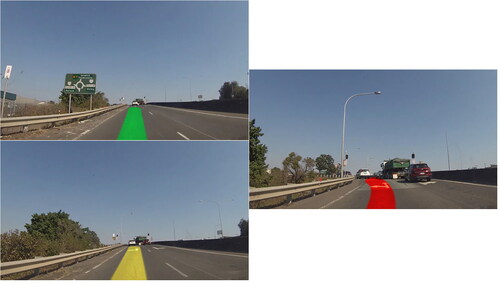
Figure 3. Photo showing the object recognition bounding boxes. Participants were explained: ‘If the car has seen another road user, say a pedestrian or another vehicle; or a traffic sign or traffic lights, it will show a BLUE BOX around it, as shown in the picture above’.
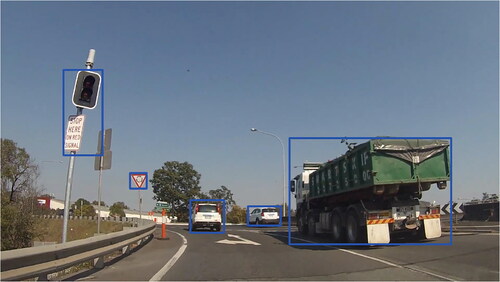
Figure 4. The photos used to explain an unsafe manoeuvre (left) and a safe manoeuvre (right).
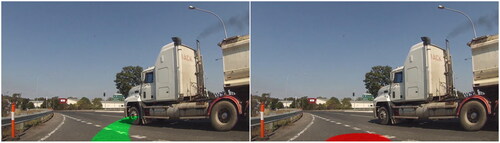
Figure 5. The photos used for the trials used in the experiment.
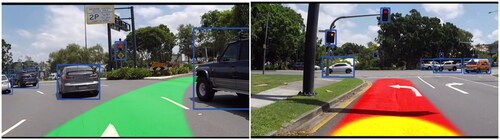
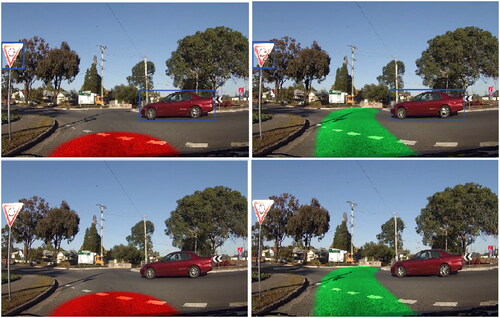
Figure 6. The same traffic scenario shown in the four different conditions. Photos in the left column are ‘safe’ manoeuvres while those in the right column are ‘unsafe’ manoeuvres. The top row includes object recognition bounding boxes whereas the bottom row does not.