Figures & data
Table 1. Mean air temperature (°C), relative humidity (%), globe temperature (°C), and Wet Bulb Globe Temperature (WBGT) outside (°C) during the conditions and for each phase in the experiment.
Figure 1. Overview of the four experimental conditions. Ascending from 0 to 13,000 ft in hypobaric hypoxia conditions took 13 min (1,000 ft per minute). In this figure, the ambient temperature (TA) is an estimated value.
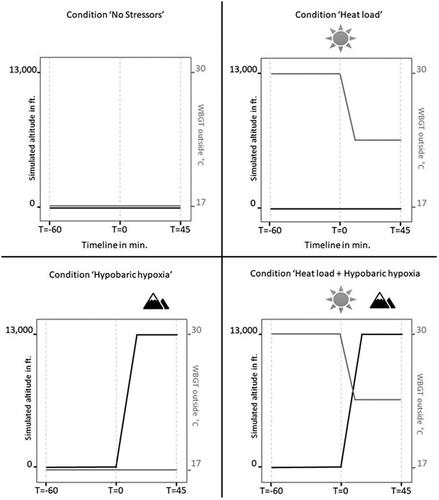
Figure 2. Timeline of the protocol. SpO2: oxygen saturation; HR: heart rate; TSK: mean skin temperature; TC: core temperature. Gradient indicates potential ambient temperature.
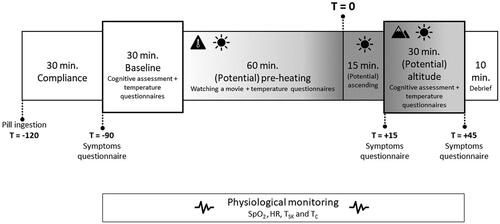
Table 2. Descriptives (mean ± SD) for each measure in each of the four conditions.
Table 3. Overview of significant and non-significant results of heat load, hypobaric hypoxia and the interaction term using univariate multilevel analysis adjusted for repeated measurements within individuals. Fs and degrees of freedom for the fixed effects with corresponding p-values are shown. Grey highlighted statistic implies a significant result.
Figure 3. Significant main and/or interaction effects of heat load and hypobaric hypoxia with mean composite (A), mean arithmetic (B), and auditory score (E) on the SYNWIN, mean arithmetic error (C), and arithmetic reaction time (RT) (D) on the SYNWIN, mean tracking error (F) and percentage stimuli missed (G) on the VigTrack, mean reaction time (RT) in seconds (H) and mean percentage stimuli missed (I) on the system monitoring task (SMT) of the MATB-II. Error bars are ±1 SE (standard error).
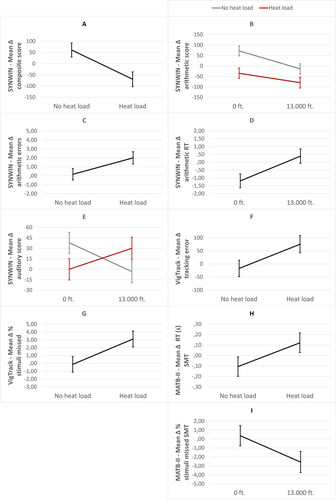
Figure 4. Significant effect of heat load on mean reaction time (RT) on the PVT in milliseconds (s). Error bars are ±1 SE (standard error).
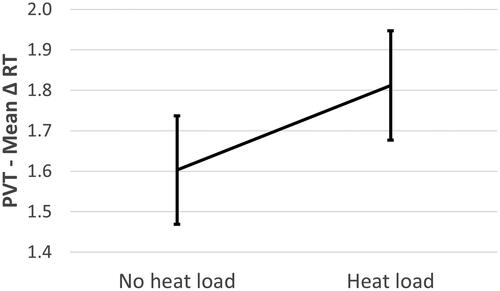
Figure 5. Significant main and/or interaction effects of heat load and hypobaric hypoxia with mean HR in beats per minute (bpm) (A), percentage SpO2 (B), mean skin temperature (TSK) (C), mean core temperature (TC) (D), mean body temperature (MBT) (E) and mean forearm-fingertip gradient (TFOREARM-FINGER) (F). Error bars are ±1 SE (standard error).
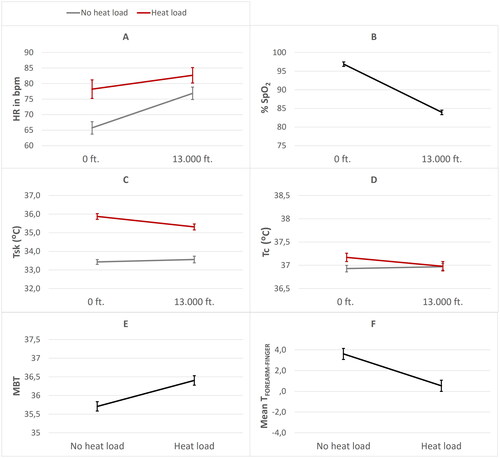
Figure 6. Significant effects of heat load and hypobaric hypoxia on subjective temperature sensation (A) and subjective thermal discomfort (B). Error bars are ±1 SE (standard error).
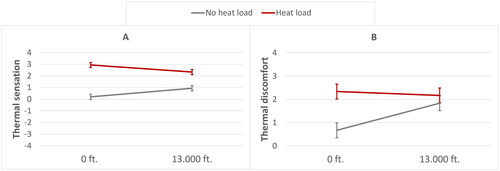
Table 4. Median and range of reported hypoxia related symptoms on a scale from 0 (none) to 7 (extreme).
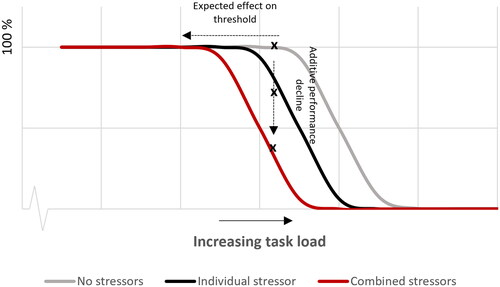
Figure 7. Expected performance curves for conditions without stressors (most right line), with one stressor (middle line), and with two stressors (most left line) as function of increasing task load based on the results of the arithmetic subtask of the SYNWIN.